


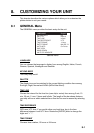
8. CUSTOMIZING YOUR UNIT
8-3
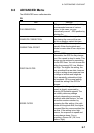
PERSPECTIVE VIEW
Chart data is projected in perspective mode, for 3D simulation, during
navigation.
DYNAMIC NAV-AIDS
Shows the flash from the lighthouse/buoy with the actual interval.
MIXING LEVELS
Detailed chart data and coarse chart data may be incorporated and displayed in
areas where they are mixed. With detailed chart data displayed and own ship
position or cursor position as reference, coarse chart data area of low accuracy
is shown in white when this setting is disabled. When enabled, coarse chart data
is shown in the same scale as detailed chart data and its location is marked with
a dots.
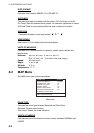
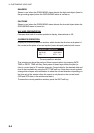
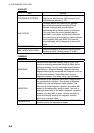
SAFETY STATUS BAR
When this item is turned On, the following menu bar appears at the top of
screen.
NORMAL BEST MAP DATA OFF DECLUT. DANGERS CAUTIONS
NORMAL (or U.ZOOM or O.ZOOM)
This indication appears to help you select a suitable chart scale.
NORMAL: Suitable chart scale is selected.
U.ZOOM: Chart scale is too small.
O.ZOOM: Chart scale is too large.
BEST MAP
Shown in red when the unsuitable chart scale is selected.
DATA OFF
Mixing levels can be turned on when the electronics chart coverage area does
not provide enough coverage to completely fill the display screen.
When the cursor or own ship mark is placed in the area with coverage, the chart
data is shown as below.
On: The chart line in the area with no coverage is shown. This area is filled with
dots.
Off: The area with no coverage is not shown (goes to white).
DECLUT.
For C-MAP MAX charts, symbols of low priority (ex. map symbols on land) can
be automatically hidden to unclutter the screen when you change the scale.
When the function is turned on, DECLUT. appears in red.