


3-4 Raychart 320 Chartplotter
➤ To zoom in:
1. Use the trackpad to move the cursor inside one of the chart boxes, and
press the lower part of the
RANGE key.
That area is expanded, with the cursor at the centre, so that you can
see more detail. Note that the smaller the chart box is on the screen,
the greater the amount of detail that is available when you zoom in.
If you have switched on Plotter Mode (see Chart Set Up Parameters
on page 4-8), you can zoom in further than the most detailed chart;
all chart functions remain available.
Displaying Object Information
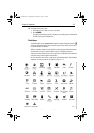
Chart cards include a number of displayed objects for which information
is available, such as lights and buoys. If your chart includes port and tide
data, this can be displayed along with information for the nearest port
facility (for a selected position). Chart source data is also available. The
context-sensitive cursor is used to select the object and display detailed
information.
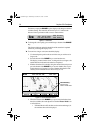
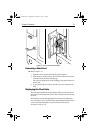
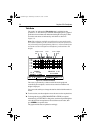
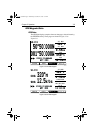
➤ To obtain the chart object, port or tide information:
1. Move the cursor over the symbol for which you require the informa-
tion. An Object data box such as the following is displayed at the
lower left corner of the screen as shown in Figure 3-2:
Figure 3-2: Typical Object Data Box
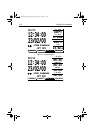
2. To view further details, press ENTER.
The details available are listed on-screen in an object information
pop-up.
3. Use the trackpad to move the selection bar over the required item then
press
ENTER to display the full details.
4. Press
CLEAR to remove the pop-up from the screen.
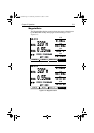
Chart Source Data
The chart card contains additional background data for most chart
objects, icons, lines, open sea areas etc. Some of these items
automatically provide an information data box, as described above. For
other chart objects, such as bridges and territorial lines, you need to press
ENTER to display the object information pop-up.
D4260-1
1 Object
Caution area
81167_3.BOOK Page 4 Wednesday, November 21, 2001 2:12 PM