


3-4
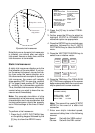
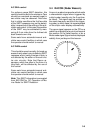
When the range to the SART is reduced
to about 1 nm, the radar display may show
also the 12 responses generated during
the fast sweeps. These additional dot re-
sponses, which also are equally spaced
by 0.64 nm, will be interspersed with the
original line of 12 dots. They will appear
slightly weaker and smaller than the origi-
nal dots.
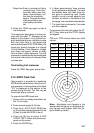
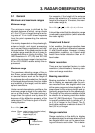
9500 MHz
9200 MHz
Radar antenna
beamwidth
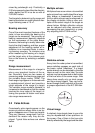
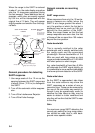
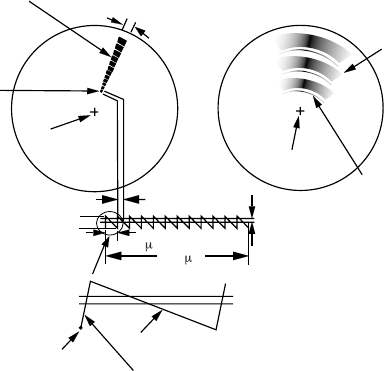
Screen A: When SART
is distant
Screen B: When SART
is close
Lines of 12 dots
are displayed in
concentric arcs.
Echo of SART
Position of
SART
Own ship's
position
Own ship's
position
SART mark
length
Radar receiver
bandwidth
Sweep time
7.5
s
95
s
Sweep start
High speed sweep signal
Low speed sweep signal
24 NM
1.5 NM
Position of
SART
Echo of
SART
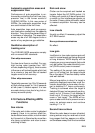
General procedure for detecting
SART response
1. Use range scale of 6 or 12 nm as the
spacing between the SART responses
is about 0.6nm (1125 m) to distinguish
the SART.
2. Turn off the automatic clutter suppres-
sion.
3. Turn off the Interference Rejector.
4. Turn off the Echo Average.
General remarks on receiving
SART
SART range errors
When responses from only the 12 low fre-
quency sweeps are visible (when the
SART is at a range greater than about 1
nm), the position at which the first dot is
displayed may be as much as 0.64 nm
beyond the true position of the SART.
When the range closes so that the fast
sweep responses are seen also, the first
of these will be no more than 150 meters
beyond the true position.
Radar bandwidth
This is normally matched to the radar
pulselength and is usually switched with
the range scale and the associated
pluselength. Narrow bandwidths of 3-5
MHz are used with long pulses on long
range and wide bandwidths of 10-25 MHz
with short pulses on short ranges.
Any radar bandwidth of less than 5 MHz
will attenuate the SART signal slightly, so
it is preferable to use a medium bandwidth
to ensure optimum detection of the SART.
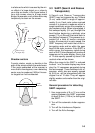
Radar side lobes
As the SART is approached, side lobes
from the radar antenna may show the
SART responses as a series of arcs or
conentric rings. These can be removed by
the use of the anti-clutter sea control al-
though it may be operationally useful to
observe the side lobes as they may be
easier to detect in clutter conditions and
also they will confirm that the SART is near
to the ship.
Gain
For maximum range SART detection the
normal gain setting for long range detec-
tion should be used, that is, with back-
ground noise speckle visible.