


24
Reference Manual
00809-1600-4530, Rev AA
Section 4: Verification Procedure with Fluid
March 2015
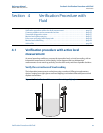
Verification Procedure with Fluid
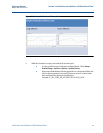
Echo curve verification at operating conditions
At normal operating conditions, download and review the echo curve according to the following
steps:
1. Check reference pulse amplitude and position. Compare the result against the previous
plots, taken during cold startup.
2. Review peak amplitudes and threshold settings. Verify that the surface and/or interface
peaks are visible and that the thresholds have been set as described in threshold
settings. See Table 4-1below for rough guidelines of amplitudes. For information on
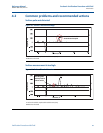
threshold settings, see “Common problems and recommended actions” on page 25.
3. Store the echo curve for future use.
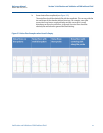
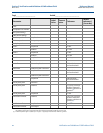
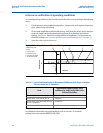
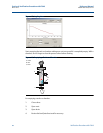
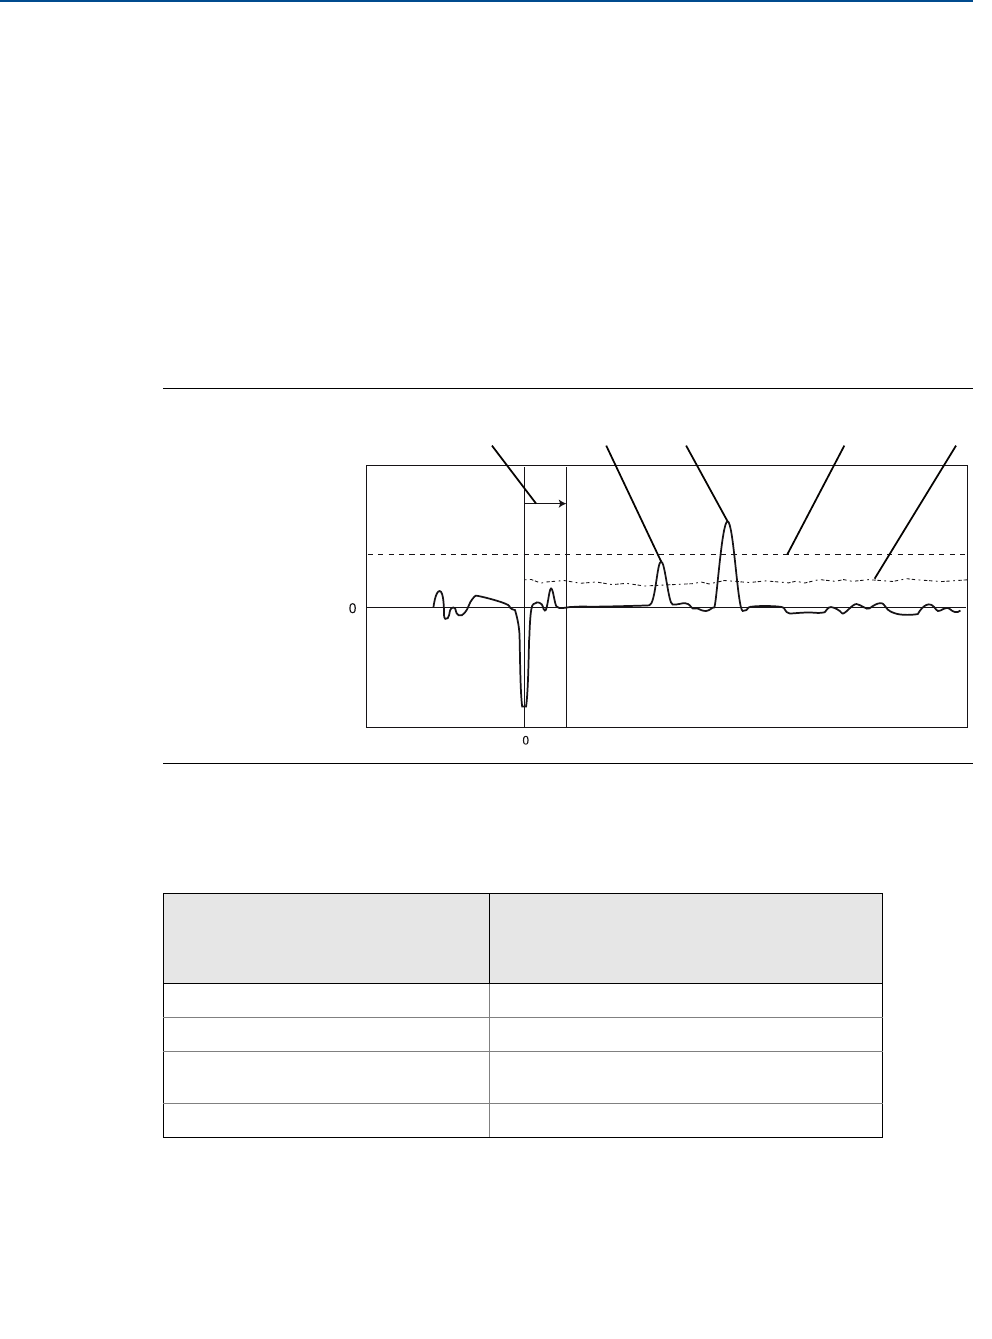
Figure 4-2. Peak Amplitudes and Threshold Settings
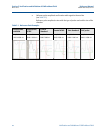
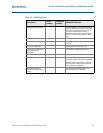
Table 4-1. Typical Peak Amplitudes for Rosemount 5300 Series with Single Lead High
Pressure Probe in 4-in. Chambers
Peak
Approximate signal strength, ideal
conditions for single lead probe in 4 in.
(100 mm) chambers
Reference peak
~
10,000 mV
(1)
(1) This value does not apply and may be considerably lower when the probe is completely submerged in product.
For additional information and signal amplitude, refer to Section C.4 Threshold
settings (document number 00809-0100-4530)
Surface peak, 5301 with oil (DC=2)
~
2,000 mV
Surface peak, 5301 with water (DC=80)
at 3 ft (1 m) distance
~
10,000 mV
Interface peak, 5302 with oil and water
~
8,000 mV
A
BCD EF
A. Reference peak
B. UNZ
C. Surface peak
D. Interface peak
E. Interface threshold
F. Surface threshold
Distance
Amplitude, mV