


56 GPSMAP 4000 Series Owner’s Manual
marIne netWork: uSInG Xm
usInG Xm
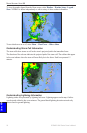
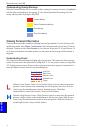
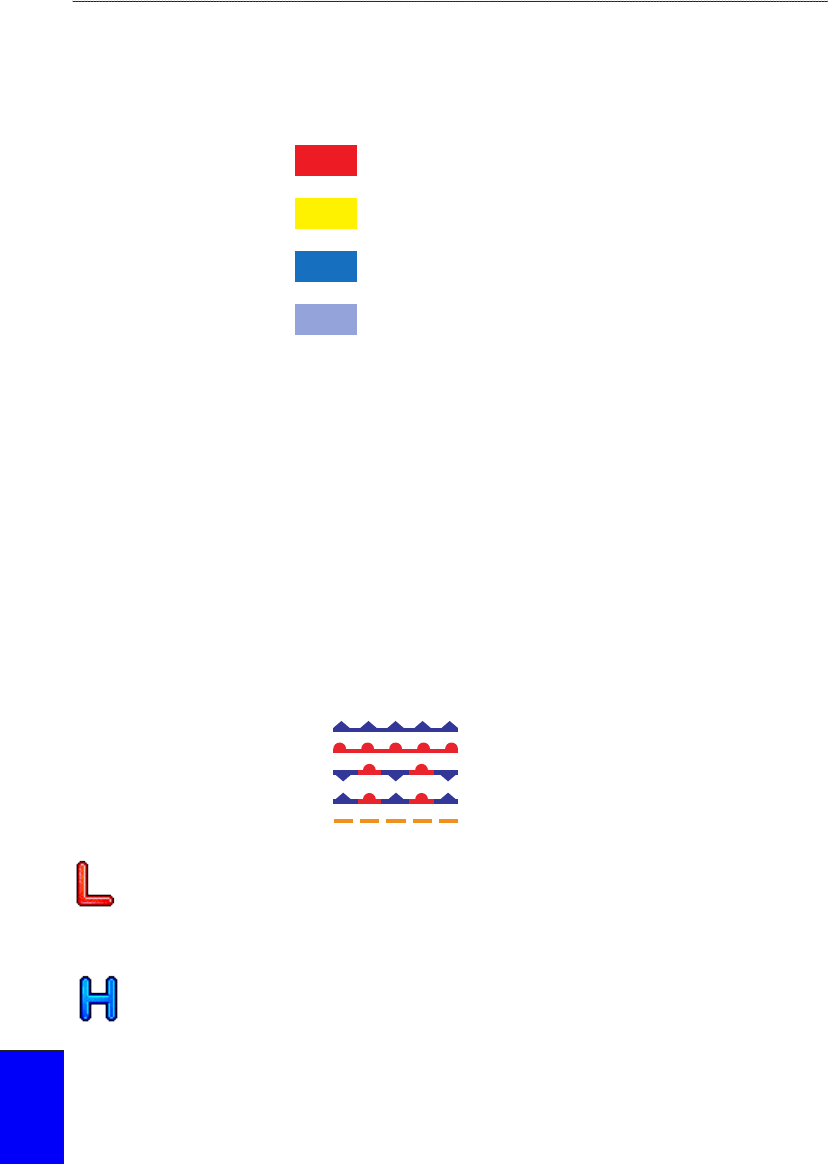
Understanding County Warnings
When the National Weather Service issues a weather warning for a county, the county is highlighted
with the color corresponding to the warning. To view information about the warning, select the
county with the pointer by using the ROCKER.
Tornado Warning
Severe Thunderstorm Warning
Flood Warning
Flash Flood Warning
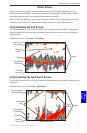
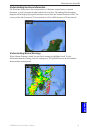
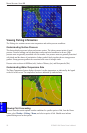
Viewing Forecast Information
Forecasts show the weather conditions including fronts and precipitation. To view the forecast for
another time period, select Menu > Next Forecast. The forecasted weather for the next 12 hours is
displayed. Continue to select Next Forecast to view forecasts for the next 24, 36, and 48 hours. To
view forecast information for another location, use the pointer to pan the map until the location is
displayed.
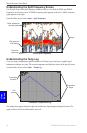
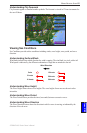
Understanding Fronts
The Fronts show lines indicating the leading edge of an air mass. This feature also shows pressure
centers. Pressure centers are represented by a large Red “L” for low pressure centers or a large Blue
“H” for high pressure centers. Pressure centers represent an area where pressure is measured to be
either the highest or lowest relative to the surrounding area.
Cold Front
Warm Front
Stationary Front
Occluded Front
Trough
Indicates a Low Pressure Center. A Low Pressure Center is an area where the measured
pressure is lowest relative to the surrounding area. Moving away from a Low Pressure
Center in any horizontal direction results in increased pressure. Winds ow
counterclockwise around Low Pressure Centers in North America.
Indicates a High Pressure Center. A High Pressure Center is an area where the measured
pressure is highest relative to the surrounding area. Moving away from a High Pressure
Center in any horizontal direction results in decreased pressure. Winds ow clockwise
around High Pressure Centers in North America.