


89
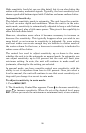
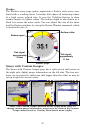
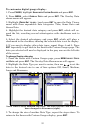
Full Sonar Chart. The Overlay Data (depth and water temperature)
are both set to the small text size.
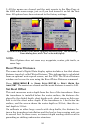
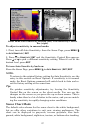
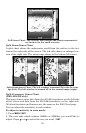
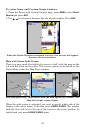
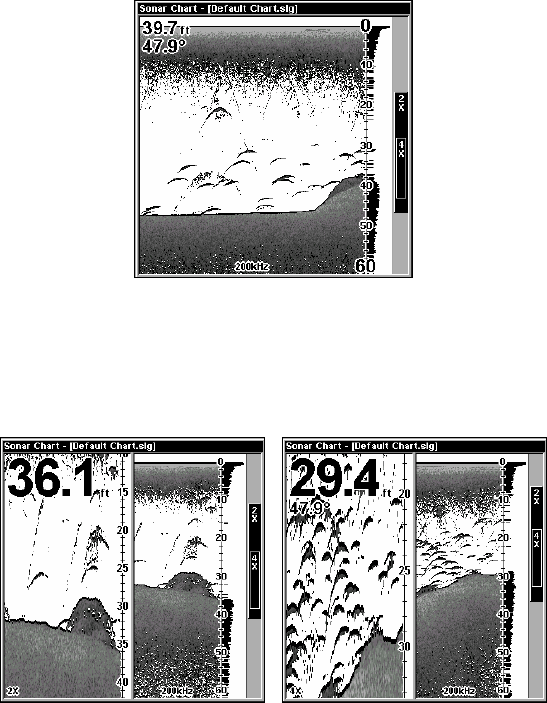
Split Zoom Sonar Chart
A split chart shows the underwater world from the surface to the bot-
tom on the right side of the screen. The left side shows an enlarged ver-
sion of the right side. The zoom range shows in the bottom left corner.
Split Zoom Sonar Chart. The left window is zoomed 2X in the first im-
age (left). The left window is zoomed 4X in the second image (right).
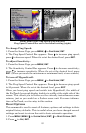
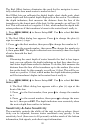
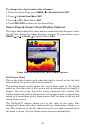
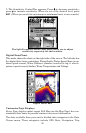
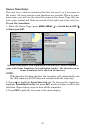
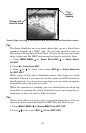
Split Frequency Sonar Chart
(LMS-525cDF only)
This page shows sonar data from the 50 kHz transducer on the left side
of the screen and data from the 200 kHz transducer on the right side.
All other functions and features are the same as the Full Chart page.
You can adjust the sensitivity in each window.
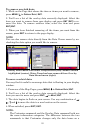
To adjust sensitivity in auto mode:
1. Press
MENU|ENT.
2. The unit asks which window (50kHz or 200kHz) you would like to
adjust. Press ← or→ to select the one you want |
ENT.