


172
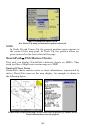
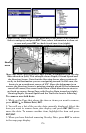
The velocity scale at the top left side of the graph changes dynamically
based upon the maximum velocity of the current for that day.
Slack water, the period of little or no current, is represented by the
Slack Water Line (SWL). The flood appears above the SWL and the ebb
appears below the SWL. You can look up tidal current data for other
dates by changing the month, day and year selection boxes.
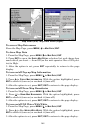
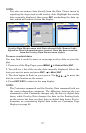
To select another date:
1. Use ← → to highlight month, day or year, then press
ENT.
2. Use ↑ ↓ to select the desired month, day or year and press
ENT.
To clear the information screen, press
EXIT.
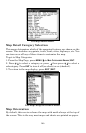
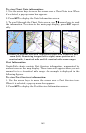
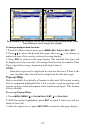
Tide Information
NauticPath charts contain Tidal Information, represented at large
zoom ranges by a box icon with the letter "T." These icons will appear
when you are zoomed in to a 6-mile range. The icon
stands for a Tidal Station location. An example is
displayed at right. When you zoom in to a suffi-
ciently small zoom range (0.8 nautical mile), the
icon becomes an animated gauge showing a rising
or falling tidal height for the selected station at the present time. At
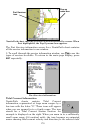
larger zoom ranges, you can select the boxed "T" icon and it becomes an
animated gauge with a pop-up name box. The name box disappears sec-
onds.
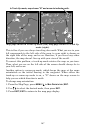
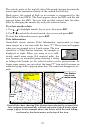
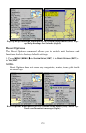
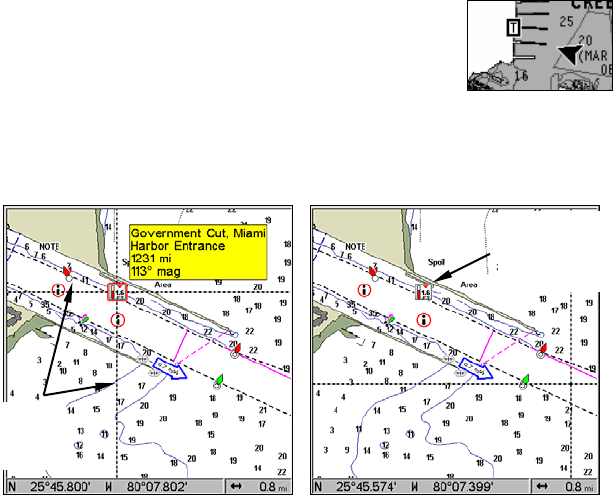
NauticPath chart showing Tide Station icon selected by cursor (left).
Icon animates automatically without selection at the 0.8-mile zoom
range (right). In the example above, the tide is at 0.9 feet and falling,
as shown by the down arrow at the top of the icon.
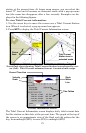
Tide Station
icon in ani-
mated mode
Cursor
lines