


81
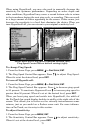
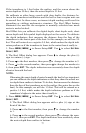
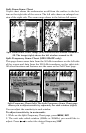
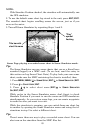
Split Zoom Sonar Chart
A split chart shows the underwater world from the surface to the bot-
tom on the right side of the screen. The left side shows an enlarged ver-
sion of the right side. The zoom range shows in the bottom left corner.
Split Zoom Sonar Chart. Image (left) shows the left window zoomed to
2X. The image (right) shows the left window zoomed to 4X.
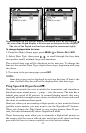
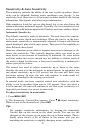
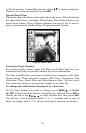
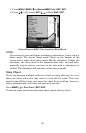
Split Frequency Sonar Chart (LMS-339cDF only)
This page shows sonar data from the 50 kHz transducer on the left side
of the screen and data from the 200 kHz transducer on the right side.
All other functions and features are the same as the Full Chart page.
Split Frequency Chart (left). The Split Frequency Sonar Chart page
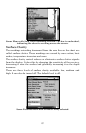
allows you to adjust sensitivity separately for each window (right).
You can adjust the sensitivity in each window.
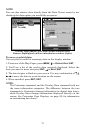
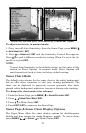
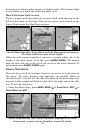
To adjust sensitivity in auto mode:
1. While on the Split Frequency Chart page, press
MENU|ENT.
2. The unit asks which window (50kHz or 200kHz) you would like to
adjust. Press ← → to select the desired frequency|
ENT.