


Astro
Dog Tracking System Owner’s Manual 37
GpS appLIcatIonS
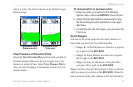
option is active, the other is shown on the Altimeter page
Options menu.
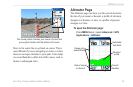
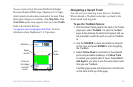
Elevation over
Distance plot
Pressure over
Time plot
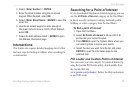
View Pressure or Elevation Plots
Select the View Elevation Plot option to plot a prole of
elevation changes that occur as you navigate over a set
distance or period of time. Select View Pressure Plot to
view a record of changes in barometric pressure for a set
period of time.
To view elevation or pressure plots:
1. Select the option you want from the Altimeter
Options menu, and press ENTER to show the plot.
2. Adjust the time and distance measurement using
the Zoom Ranges option explained on the pages
that follow.
3. To clear the plot and start again, you must clear the
Track Log.
Zoom Ranges
You can set the zoom ranges for elevation, distance, or
time when you show the View Elevation Plot.
Ranges for vertical distance are shown as you press
up or down on the ROCKER.
Ranges for linear distance are shown as you press
left or right on the ROCKER.
Ranges for time are shown for a time plot when
you press left or right on the ROCKER.
Ranges for View Pressure Plot pressure values are shown
when you press up or down on the ROCKER. Values for
time are shown in the same manner as for elevation plots.
•
•
•