


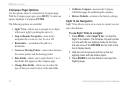


36 Astro Dog Tracking System Owner’s Manual
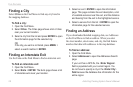
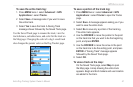
GpS appLIcatIonS
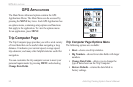
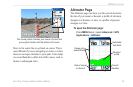
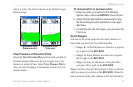
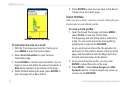
The Status eld at the bottom of the page shows the
current elevation and your current rate of ascent or
descent when moving. It can also show the ambient
pressure and time of measurement.
You can congure the prole eld in the center of the
page to show either elevation or ambient pressure plots as
selected from the Altimeter page Options Menu.
Data elds at the top of the page are user selectable and
show a variety of recorded or current data.
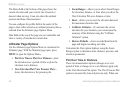
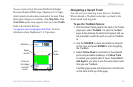
Altimeter Page Options
Use the Altimeter page Options Menu to customize the
Altimeter page. With the Altimeter page open, press
MENU to open the Options Menu.
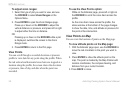
Plot Over Time or Plot Over Distance—plots
the elevation over a period of time or plots the
elevation over a distance.
View Elevation Plot (View Pressure Plot)—
shows the elevation or the pressure plot.
•
•
Zoom Ranges—allows you to select Zoom Ranges
for elevation, distance, or time when you show the
View Elevation Plot over distance or time.
Reset—allows you to reset the elevation data and
the maximum elevation data.
Calibrate Altimeter—If you know the correct
elevation for your location, you can increase the
accuracy of the altimeter using the “Calibrate
Altimeter” option.
Restore Defaults—clears recorded data from the
page and begins recording new data.
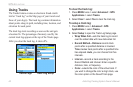
Customize the View option displays using the Zoom
Ranges option to determine time, distance, pressure, and
elevation parameters.
Plot Over Time or Distance
These two measurement options (changes over a set
period of time or changes over a set distance) apply only
to the View Elevation Plot option. The View Pressure Plot
option is measured by time and pressure only. When one
•
•
•
•