79
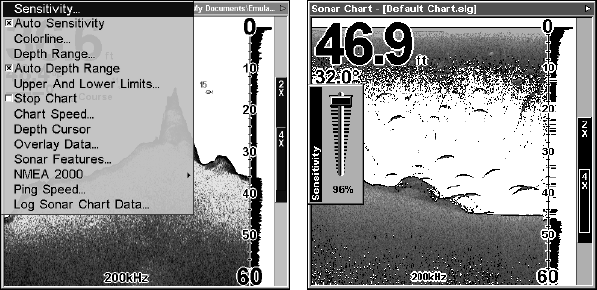
Sensitivity selected (left). The Sensitivity Control Bar (right).
To adjust sensitivity in manual mode:
1. First, turn off Auto Sensitivity: from the Sonar Page, press
MENU|↓
to
AUTO SENSITIVITY|ENT.
2. Press ↑ to
SENSITIVITY|ENT and the Sensitivity Control Bar appears.
Press ↓ ↑ to pick a different sensitivity setting. When it's set at the de-
sired level, press
EXIT.
NOTE:
To reset Auto Sensitivity to the default setting, see the entry in this
section on Reset Options. In manual mode, Reset Options will
switch sensitivity back to Auto, its factory default setting.
Sonar Chart Mode
The default color scheme for the sonar chart is the white background,
but we offer other variations to suit your viewing preferences. The
chart can be displayed in grayscale, reverse grayscale, blue back-
ground, white background, nightview, iceview or bottom color tracking.
To change the chart mode color scheme:+
1. From the Sonar Page, press
MENU|↓ to SONAR FEATURES|ENT.
2. Press ↓ →
SONAR CHART MODE|ENT.
3. Press ↓ ↑ to Mode Name|
ENT.
4. Press
EXIT|EXIT to return to the Sonar Page.
Sonar Page & Sonar Chart Display Options
The Pages Menu offers five chart display options for dual-frequency
models and four options for single-frequency models. To access them,
press
PAGES|← → to SONAR|↓ to Option Name|EXIT.
