


8-4
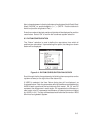
speed, space-bar to pause, enter-key to play and the esc-key to exit the
Satellite Visibility Sky Menu.
8.2 DOP/BAR CHART
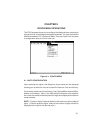
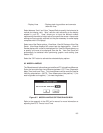
After selecting “DOP/Bar Chart”, select the almanac file to be used in
calculating the Satellite Visibility DOP/Bar Chart from the Almanac Select
dialog box. Select “OK” to continue.
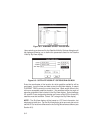
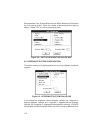
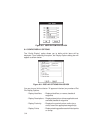
Upon selecting an almanac file, the Satellite Visibility Options dialog box will
be displayed allowing you to define the parameters used for the Satellite
Visibility DOP/Bar Chart display.
Enter the coordinates of the location and the date for which satellite
availability will be previewed. (You may select CURRENT TIME to enter the
current date.) Again, mask angle refers to the minimum acceptable satellite
elevation. Select between 3D or 2D-Fixes, specifying the number of
satellites that must be visible. Select “OK” to display the chart.
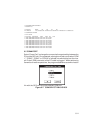
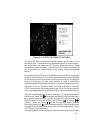
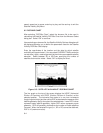
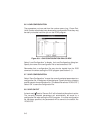
Figure 8-5: SATELLITE AVAILABILITY DOP/BAR CHART
The line graph on the top of the screen displays the HDOP (Horizontal
Dilution of Precision) and PDOP (Position Dilution of Precision) at the
selected position. The horizontal time scale is in one hour increments
(beginning at midnight) and the vertical DOP scale shows the measure of the
satellite geometry quality throughout the selected date. Lower DOP values
represent better satellite geometry; higher DOP values represent poorer
geometry. DOP will generally decrease as the number of visible satellites
increase. When the selected fix-type (i.e., 3D or 2D) cannot be obtained,
DOP is 10 (maximum value).