


6-9
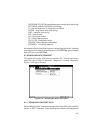
While the data is being transferred, the bar graph will monitor the progression
of the data transfer, and the number of data packets on the unit's Interface
Control page will increment as the data is received.
On certain units, the uploaded waypoints will not be displayed if the unit is not
in an active or simulated navigation mode, (i.e. operating indoors with poor
GPS coverage). The uploaded waypoints will be displayed on the Map Page
after a unit power is cycled or navigation becomes active.
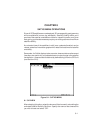
6.4 REAL TIME PLOTTING/LOGGING
Select “Realtime Plotting/Logging” to receive real time data from the unit and
monitor your position graphically (as well as viewing it in text form).
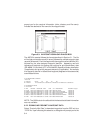
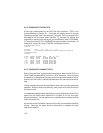
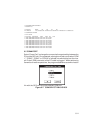
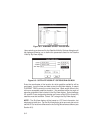
In the Display Plot Options dialog box, select between “Add to Plot” and
“Clear Plot”. “Add to Plot” appends to the currently displayed plot; “Clear Plot”
clears the current plot prior to plotting any data.
Figure 6-5: DISPLAY PLOT OPTIONS DIALOG BOX
You must also select between “File and Screen” or “Screen Only”. “File and
Screen” logs data to a file while displaying it on your monitor (you will be
requested to specify file information); “Screen Only” displays data to your PC
screen only (you may still save the plot to a file later).
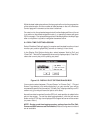
As real time data is received from the GPS unit, each position is added to the
plot on the screen. To end the data logging session, click the left mouse
button on the STOP sign icon displayed in the upper left corner of the screen
(or press <Esc>).
NOTE: During a real time logging session, options from the File, Edit,
Comm and SatVis menus are unavailable; Plot and Config menu functions
are all available.