2-4
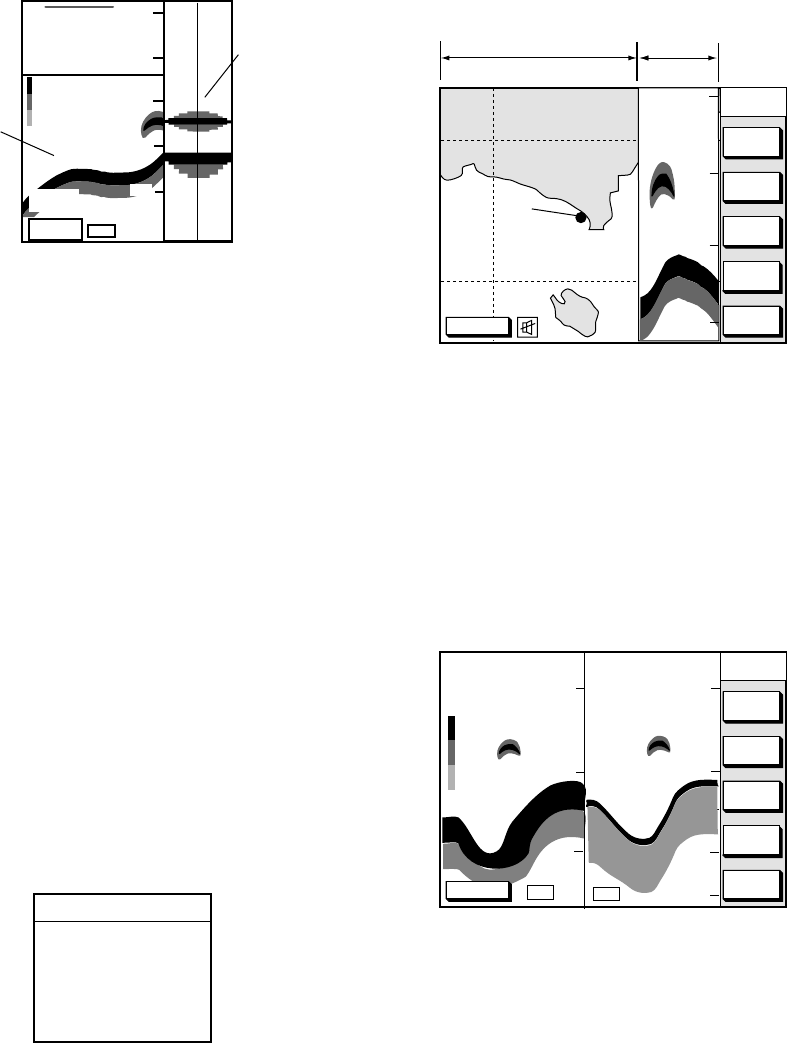
A-scope display
This display shows echoes at each transmis-
sion with amplitudes and tone proportional
to their intensities, on the right 1/3 of the
screen. It is useful for estimating the kind of
fish school and seabed composition.
200k
160
0
50
100
150
200
68.3
Normal
sounder
display
A-scope
display
DGPS3D
Figure 2-10 A-scope display
plus normal sounder display
2.3 Plotter/Sounder Display
This display provides the plotter display on
the left part of the screen and the normal
sounder display on the right part. It is useful
for searching fish schools at cruising speed.
The width of the sounder display can be se-
lected between standard (approx. 20 mm)
and wide (approx. 40 mm).
1. Press the [MENU] key and the soft key
SOUNDER SETUP OPTIONS. The
sounder setup menu appears. See Fig-
ure 1-9.
2. Press ▼ to select E/S WINDOW window.
3. Press the soft key EDIT to show the E/S
WINDOW window.
E/S WINDOW
▲
'
STD
▼
™WIDE
Figure 2-11
4. Press ▲ or ▼ to select STD or WIDE.
STD: The width of the sounder display is
approx. 20 mm (Default setting).
WIDE: The width is approx. 40 mm.
5. Press the [ENTER] key or the soft key
ENTER.
DGPS 3D
PLOT
COURSE
UP
ZOOM
OUT
ZOOM
IN
NORTH
UP
0
50
100
150
SNDRSNDR
PLOT
Plotter Display
Sounder
Display
Figure 2-12 Plotter/Sounder display
2.4 Dual-frequency Display
The 50 kHz picture appears on the left; the
200 kHz picture on the right. This display is
useful for comparing the same picture with
two different sounding frequencies.
DGPS 3D
PLOT
MODE
GAIN
200kHz
RANGE
SOUNDER
DUAL
100
SNDR
SHIFT
50k
0.0
200k
20
40
60
GAIN
50kHz
20
40
60
80
Figure 2-13 Dual-frequency display


