


2-2
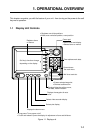
2.2 Sounder Display
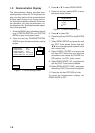
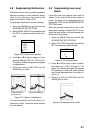
Description
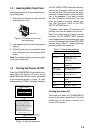
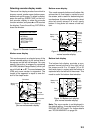
The figure below shows all indications and
markers which may appear on the normal
sounder display.
Normal sounder display
indications, markers
SNDR
FUNC
SHIFT
GAIN
RANGE
SOUNDER
135° 12.345’ E
34° 12.345’ N
SPD
CSE
16.3kt
245.8°
MODE/
FREQ
50k
DGPS 3D
Nav information
window
Color
bar
Functions for
soft keys
Variable
Range
Marker
(white)
Depth scale
Tx frequency
GPS status
Depth
20
30
40
50
30
20
10
0
Temp.
scale
Water
temp.
Graph
Water
temp.
display
54.0
15.0
Figure 2-2 Indications on
the normal sounder display
Note: The water temperature graph can be
set on or off (See page 11-4.). The tempera-
ture scale is fixed between 20-80 °F (0 to
30°C).
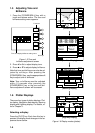
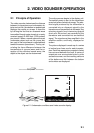
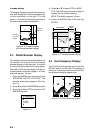
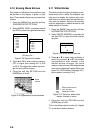
The normal sounder display shows either the
50 kHz picture or 200 kHz picture. To switch
between these pictures, do the following:
1. Press the [SNDR] key several times to
show the normal sounder display.
DGPS 3D
PLOT
SNDR
FUNC
GAIN
RANGE
SOUNDER
50
100
150
SNDR
MODE/
FREQ
SHIFT
0
50k
0.0
Figure 2-3 Normal sounder display
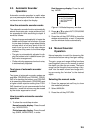
2. Press the soft key MODE/FREQ. The dis-
play changes as below.
DGPS 3D
RETURN
SELECT
50kHz
SOUNDER
50
100
150
0
50k
0.0
SELECT
200kHz
MODE/FREQ
▲
' AUTO CRUISING
™ AUTO FISHING
™ MANUAL
▼
Figure 2-4 Mode/freq window
3. Press the soft key SELECT 200kHz (SE-
LECT 50kHz).
4. Press the soft key RETURN to manually
close the window, or wait 10 seconds and
the window automatically closes.
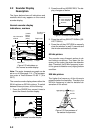
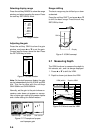
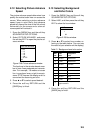
50 kHz picture
The sounder uses ultrasonic pulses to de-
tect bottom conditions. The lower the fre-
quency of the pulse, the wider the detection
area. Therefore, the 50 kHz frequency is use-
ful for general detection and judging bottom
condition.
200 kHz picture
The higher the frequency of the ultrasonic
pulse the better the resolution. Therefore, the
200 kHz frequency is ideal for detailed ob-
servation of fish school.
50 kHz
200 kHz
Figure 2-5 Comparisons of
transducer frequencies