


- 75 -
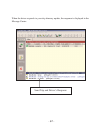
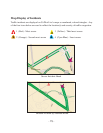
Map Display of Incidents
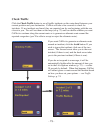
Traffic incidents are displayed on CoPilot Live’s maps as numbered, colored triangles. Any
of the four icons below are used to reflect the location(s) and severity of traffic congestion.
1 (Red) - Most severe 3 (Yellow) - Third most severe
2 (Orange) - Second most severe 4 (Cyan Blue) - Least severe
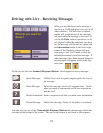
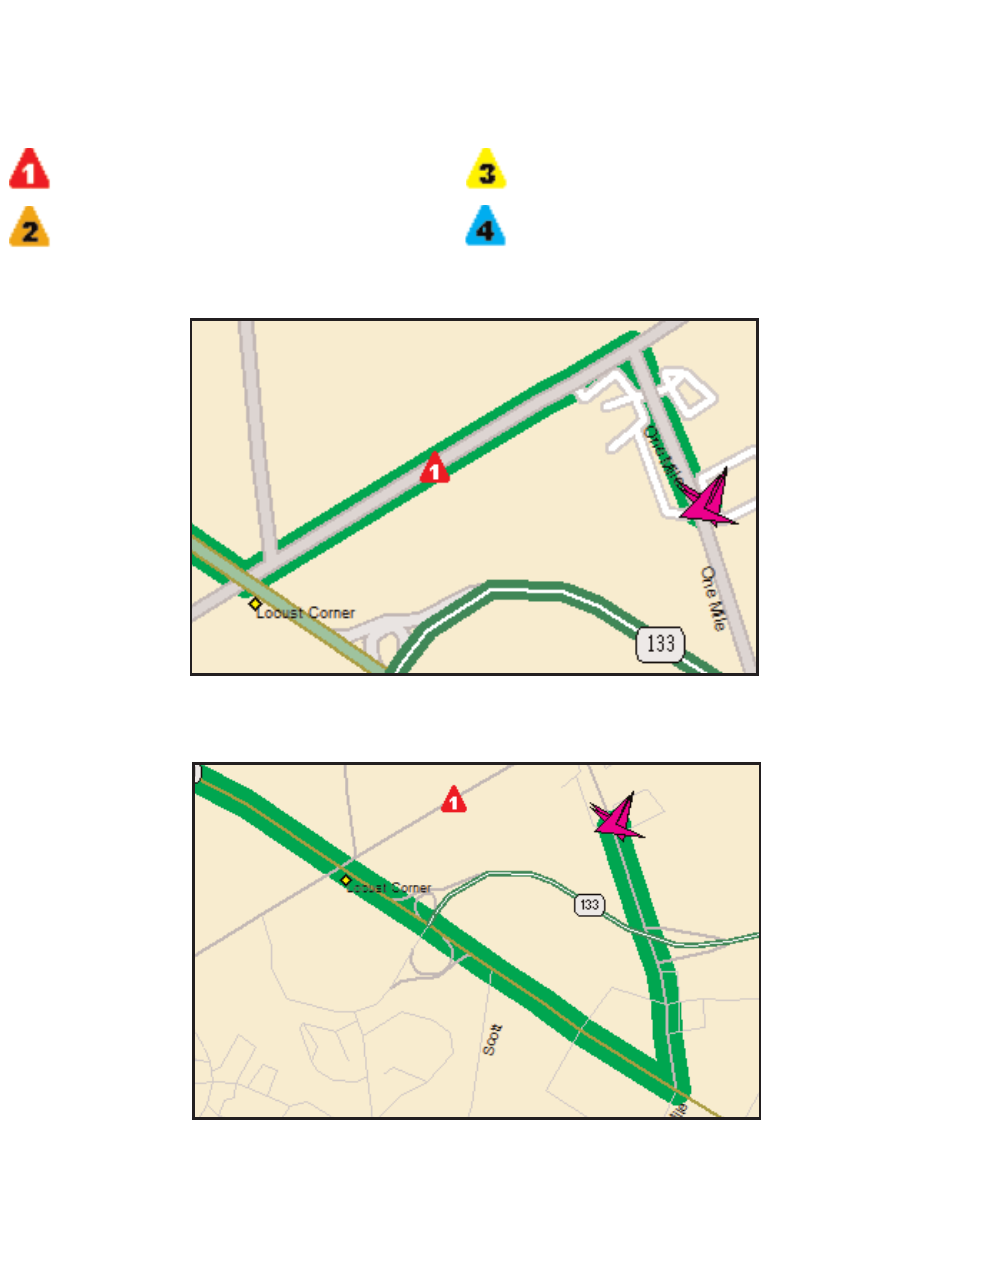
Severe Incident Ahead
Incident Avoided by Alternate Route