


41
6 F 8 A 0 9 3 4
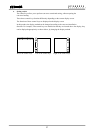
8. Bar graph display
Bar graph can be set only for Display 2.
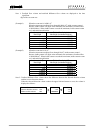
About Range type, percent display and percent value when bar graph is displayed
When percent display is used, the % value displayed depends on the flow direction. However,
the % value when bar graph is displayed is as shown in the table below.
Range type Input signal
% value in
percent display
% value in
bar graph
4−20mA output
Single(forward) Forward direction
50%
50%
50%
12mA
Single(forward) Reverse direction
50%
-50%
0% 4mA
(Output low lim value*)
Bidirectional
(forward/reverse)
Forward direction
50%
50%
50%
12mA
Bidirectional
(forward/reverse)
Reverse direction
50%
-50%
0%
12mA
The set value in 8.2.17 “Output Low Limit Setting” will be output.
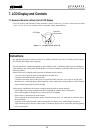
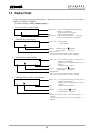
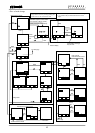
• When communications function is used
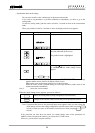
When HART communication is used, a mark is displayed in the upper field on the display.
When PROFIBUS communication is used, if the communication is made between the PROFIBUS
option board and the converter main board, a mark is displayed in the upper field on the display in the
same way as in HART communication, while communication between the PROFIBUS option board
and the external bus, nothing is displayed.
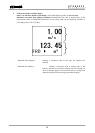
Displayed when communications
function is used
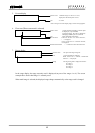
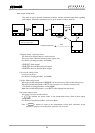
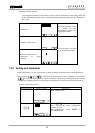
Graph The measured value is displayed in bar graph.
The left side of the graph is RL (Range Low limit) and
the right side of the graph is RH (Range High limit).
Scale marks are displayed in increments of 25% inside
the graph.
Range The range number currently used is displayed.