


10
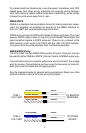
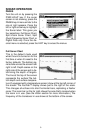
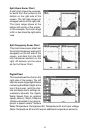
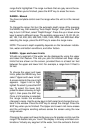
Split Zoom Sonar Chart
A split chart shows the underwa-
ter world from the surface to the
bottom on the right side of the
screen. The left side shows an
enlarged version of the right side.
The zoom range shows at the
bottom left corner of the screen.
In this example, the zoom range
is 2X, or two times the right side’s
view.
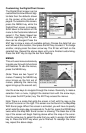
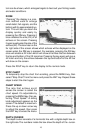
Split Frequency Sonar Chart
This chart shows sonar data from
the 50 kHz transducer element (if
equipped) on the left side of the
screen, and data from the 200
kHz transducer element on the
right. All features are the same
as the Full Sonar Chart.
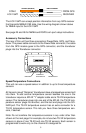
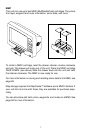
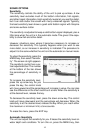
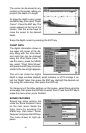
Digital/Chart
This mode shows the chart on the
right side of the screen. The left
side has seven large digital boxes
containing the Water Depth at the
top of the screen, (with the shal-
low and deep alarm settings im-
mediately beneath the depth)
Water Speed (from an optional
speed sensor), Water Distance
(distance travelled or log) also re-
quires a speed sensor. Surface
Water Temperature, Temperature #2, Temperature #3, and input voltage.
(Note: Temperature #2 and #3 require additional temperature sensors.)