


25
Getting Started
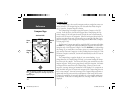
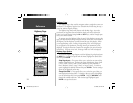
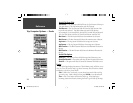
To pan along the length of the plot, press the ROCKER key to the Left or
Right. This will display a crosshair that will track along the plot. Data for the
selected plot point will be shown in labels along the vertical and horizontal scales.
To exit the panning mode, press the QUIT key.
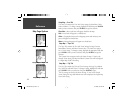
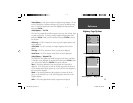
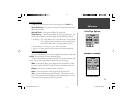
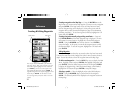
Plot Page Options
Plot Barometer/Plot Ambient Pressure —
Sets the Plot Page to show either
Barometric or Ambient pressure over time. These options will only be avail-
able when the unit is plotting pressure.
Plot Over Time/ Plot Over Distance —
These options will only be available
when the unit is plotting elevation. Selecting ‘Plot Over Distance’ sets the
horizontal scale of the plot to show distance. Selecting ‘Plot Over Time’ sets
the horizontal scale of the plot to show time. The plot will be able to show
data stored for the last 72 hours or the last 80 miles/120 kilometers travled.
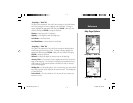
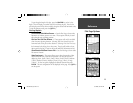
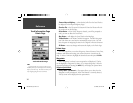
Show Elevation Plot/Show Pressure Plot —
Sets the Plot Page to show either
Elevation or Pressure.
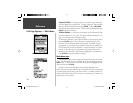
Setup Page Layout —
This option allows you to select the number of data
fi eld rows and the size of text used in the fi elds. You have the option of
displaying, None, Small (1 Row), Small (2 Rows), Small (3 Rows), Medium
(1 Row), Medium (2 Rows), Medium (3 Rows), Large (1 Row), or Large
(2 Rows). To select an option, highlight the desired selection then press
ENTER. The new confi guration will be displayed on the page. Press QUIT to
exit the option.
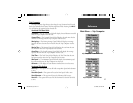
Plot Page Options
Reference
Panning the Plot Page
Plot Page Options
190-00249-00_0C.indd 25 5/7/2003, 9:54:44 AM