


1-28
1.25 Electronic Plotting Aid (EPA)
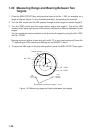
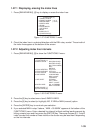
A maximum 10 operator-selected targets can be plotted electronically to assess their motion
trend. Five past positions can be displayed for each of the plotted targets. If you enter a
6th plot on a certain target, the oldest plot (past position) will be erased.
A vector appears when you enter a second plot for the target and is updated each time a
new plot is entered. The vector shows the target motion trend based on its latest two plots.
The vector origin will move across the screen at a rate and direction defined by the calcu-
lated true course and speed until a next manual plotting.
Target data is shown in the data display area which shows bearing, course, speed, CPA,
TCPA, BCR, BCT calculated true course of targets, calculated true speed of targets.
000
010
020
030
040
050
060
070
080
090
100
110
120
130
140
150
160
170
180
190
200
210
220
230
240
250
260
270
280
290
300
310
320
330
340
350
01
Vector Time
EPA DATA
EPA
TRUE VECTOR 6MIN BT
0 : 03
Elapsed Time
Speed Reference
(Bottom Tracking
or Water Tracking)
Vector Reference
(True or Relative)
0.439SM
122.7°T
254.2°T BT TRU
14.9KT BT TRU
0.4SM
0.0MIN
0.8SM
99.9MIN
RNG
BRG
CSE
SPD
CPA
TCPA
BCR
BCT>
01
NOTES:
• Target 1 is on a collision course.
• TCPA calculated up to 99.9 min. TCPA
higher than this is shown as >*99.9MIN.
Course
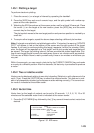
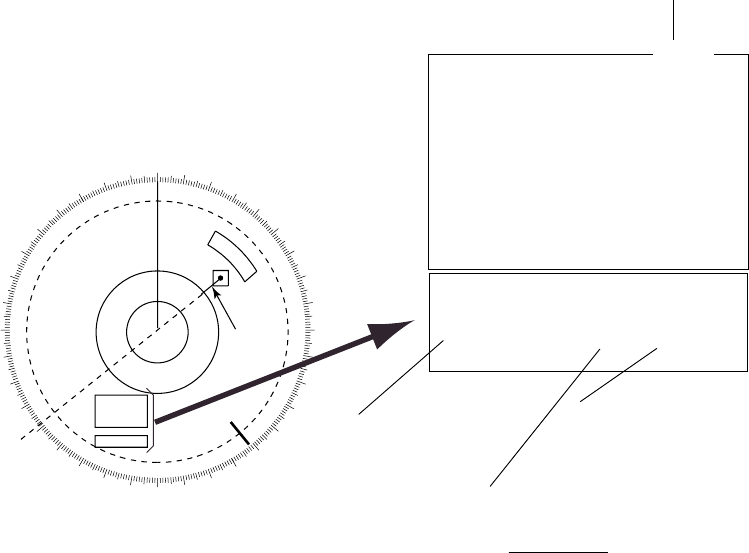
Figure 1-30 Sample EPA display
Target 01 in Figure 1-30 is on a collision course as the extension of the vector goes through
the own ship position. Placing the offset EBL on the target will be a help for assessment.
TCPA is counted up to 99.9 minutes and beyond this it is indicated as TCPA >* 99.9 MIN.
Note: EPA requires speed input (automatic or manual) and a heading signal. The vector
and data are updated automatically every 1-2 scenes between plot entries, but do not
neglect to plot a new position over a long period of time. The accuracy will be reduced.
Note the plots will be lost when the gyrocompass fails; start the plotting exercise again.