122
These icons indicate your fuel efficiency measured against an average value which is config-
ured by the dispatcher.** These icons are not shown, when the status bar is configured to
show the current fuel consumption (3) and the average fuel consumption (4).
3. The current fuel consumption rate.**
4. The average fuel consumption rate of the current trip.**
Note: The current and the average fuel consumption rates are shown in red or in green in the
same way as the fuel efficiency indicators above.
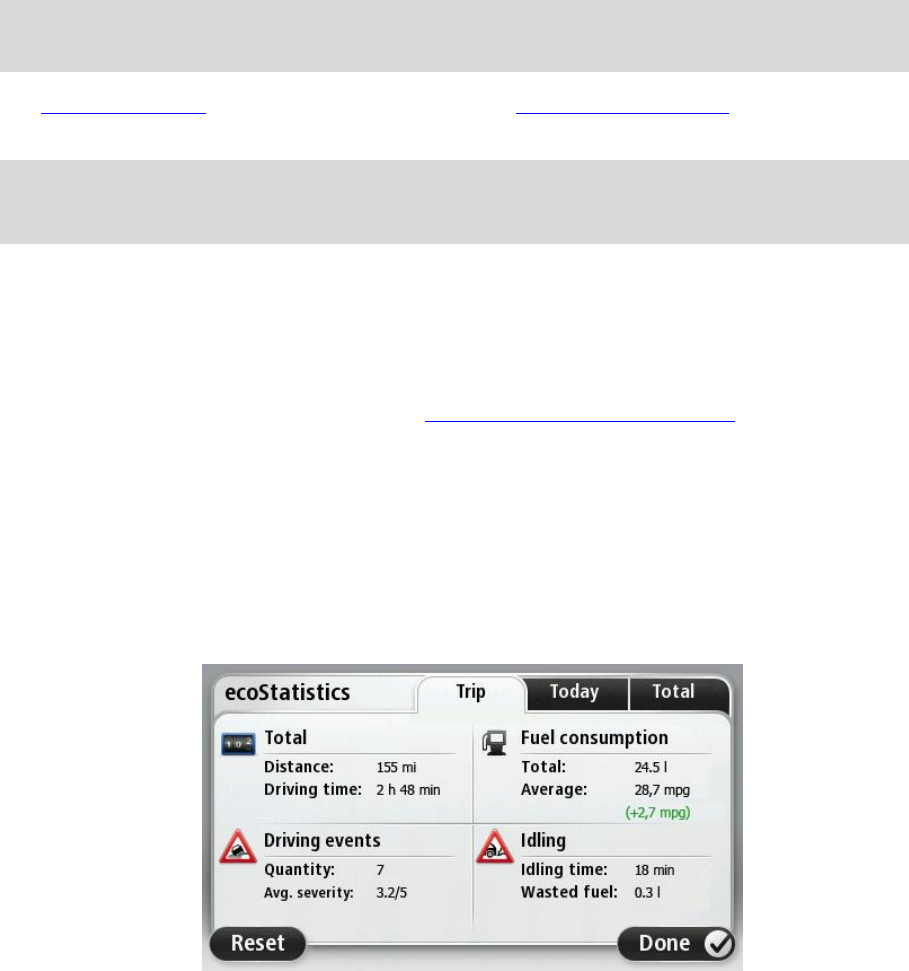
The ecoStatistics view shows you an overview over the Active Driver Feedback with detailed in-
formation about the safety and efficiency of your driving style per trip.
* Installed TomTom LINK required.
** Installed TomTom ecoPLUS and LINK required.
Active driver feedback
When the LINK is installed in your vehicle, your PRO can collect information about driving events
such as harsh braking, fast cornering, the time your vehicle is idling and fuel consumption**.
While you are driving you are informed about driving events in the Driving View. Detailed infor-
mation about safety and efficiency is shown on the ecoStatistics page:
1. Tap the Driving View to bring up the Main Menu.
2. Tap WORK.
3. Tap ecoStatistics.
4. Select the tab Last trip, Today or Total.
To reset the values of the active tab to 0 tap Reset.
The ecoStatistics view shows you the following details per trip, per day or in total:
The distance and time driven.
The number of driving events and their average severity.
The total fuel consumption and how it compares to a reference value.
The time spent stationary with the engine running for longer than five minutes and the fuel
you have used.


