


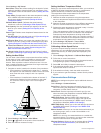

A Garmin SiriusXM satellite weather receiver and antenna
receives satellite weather data and shows it on various Garmin
devices, including the Navigation chart on a compatible
chartplotter. The weather data for each feature comes from
reputable weather data centers such as the National Weather
Service and the Hydrometeorological Prediction Center. For
more information, go to www.siriusxm.com/sxmmarine.
SiriusXM Equipment and Subscription
Requirements
To use satellite weather, you must have a compatible satellite
weather receiver. To use SiriusXM satellite radio, you must
have a compatible satellite radio receiver. Go to
www.garmin.com for more information. You must also have a
valid subscription to receive satellite weather and radio. For
more information, refer to the instructions for your satellite
weather and radio equipment.
Weather Data Broadcasts
Weather data is broadcast at different intervals for each weather
feature. For example, radar is broadcast at five-minute intervals.
When the Garmin receiver is turned on, or when a different
weather feature is selected, the receiver must receive new data
before it can be shown. You might experience a delay before
weather data or a different feature appears on the chart.
NOTE: Any weather feature can change in appearance if the
source that provides the information changes.
Viewing Precipitation Information
Precipitation ranging from very light rain and snow, up to strong
thunderstorms, is indicated in varying shades and colors.
Precipitation is shown either independently or with other
weather information.
Select Weather > Precipitation.
The time stamp in the upper-left corner of the screen
indicates the elapsed time since the weather data provider
last updated the information.
Precipitation Views
From the precipitation weather chart, select MENU.
Radar Loop: Shows precipitation information as an image of
the latest update or as an animated loop of the latest
updates. The time stamp indicates the elapsed time since
the service provider generated the weather radar frame
currently displayed on the screen.
Cloud Cover: Shows cloud cover data.
Waypoints: Shows waypoints.
Legend: Shows the weather legend.
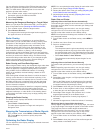
Storm Cell and Lightning Information
Storm cell are represented by on the weather precipitation
chart. They indicate both the present position of a storm and the
projected path of that storm in the immediate future.
Red cones appear with a storm cell icon, and the widest part of
each cone points in the direction of the projected path of the
storm cell. The red lines in each cone indicate where the storm
will most likely be in the near future. Each line represents 15
minutes.
Lightning strikes are represented by . Lightning appears on
the weather precipitation chart if strikes were detected within the
last seven minutes. The ground-based lightning detection
network detects cloud-to-ground lightning only.
NOTE: This feature is not available on all devices and in all
subscriptions.
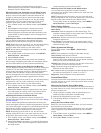
Hurricane Information
The weather Precipitation chart can show the present position
of a hurricane , a tropical storm, or a tropical depression. A
red line stemming from a hurricane icon indicates the projected
path of the hurricane. Darkened dots on the red line indicate the
projected locations through which the hurricane will pass, as
received from the weather data provider.
Weather Warnings and Weather Bulletins
When a marine weather warning, weather watch, weather
advisory, weather bulletin, or other weather statement is issued,
shading indicates the area to which the information applies. The
aqua lines on the chart indicate the boundaries of marine
forecasts, coastal forecasts, and offshore forecasts. Weather
bulletins may consist of either weather watches or weather
advisories.
To view information about the warning or bulletin, select the
shaded area.
Color Marine Weather Group
Cyan Flash Flood
Blue Flood
Red Marine
Yellow Severe Storm
Red Tornado
Forecast Information
The Forecast chart shows city forecasts, marine forecasts,
warnings, hurricane warnings, METARS, county warnings,
weather fronts and pressure centers, surface pressure, and
weather buoys.
Viewing Forecast Information for Another Time
Period
1
Select Weather > Forecast.
2
Select an option:
• To view the weather forecast for the next 12 hours, select
Next Forecast, and to view forecasts up to 48 hours, in
12-hour increments, select Next Forecast again.
• To view the weather forecast for the previous 12 hours,
select Previous Forecast, and to view previous
forecasts, up to 48 hours ago, in 12-hour increments,
select Previous Forecast again.
Viewing a Marine Forecast or an Offshore Forecast
1
Select Weather > Forecast.
2
Pan the chart to an offshore location.
The Marine Forecast or Offshore Forecast options appear
when forecast information is available.
3
Select Marine Forecast or Offshore Forecast.
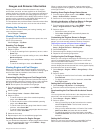
Weather Fronts and Pressure Centers
Weather fronts appear as lines that indicate the leading edge of
an air mass.
Front Symbol Description
Cold front
Warm front
Stationary front
Occluded front
Trough
Pressure-center symbols often appear near weather fronts.
26 SiriusXM Weather