


3. PLOTTER OPERATION
3-10
3.5 Chart Cards
3.5.1 Chart card overview
Your plotter uses FURUNO and NavCharts™ (NAVIONICS) charts, or C-MAP
charts, depending on the type of display unit you have.
When you insert a suitable chart card in the slot and your boat is any
cartographic object, a chart appears. If a wrong card is inserted or a wrong chart
scale is selected, landmasses will appear hollow. Chart icons appear at the top
of the display to help you select a suitable chart scale. The table below shows
the chart icons and their meanings.
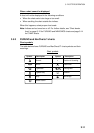
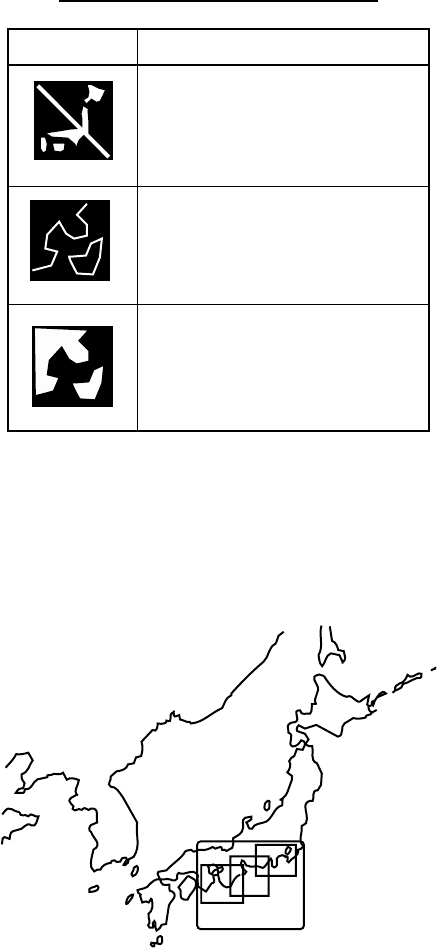
Chart icons and their meanings
Icon Meaning
Proper card is not inserted or
chart scale is too small.
Operate the RANGE key to
adjust chart scale.
Chart scale is too large.
Operate the RANGE key to
adjust chart scale.
Suitable chart scale is
selected.
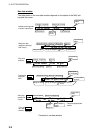
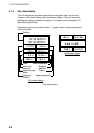
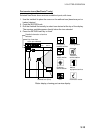
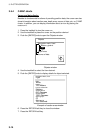
3.5.2 Indices and chart enlargement
When the [RANGE] key is operated, you will see several frames appear on the
chart. These frames are called indices and they show you what parts of the chart
can be enlarged in the current range.
Sample chart (Japan), showing indices