


3-14
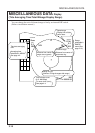
TIDE VECTOR/COURSE PLOT SECTION
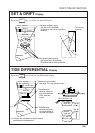
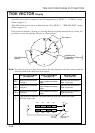
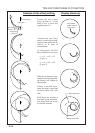
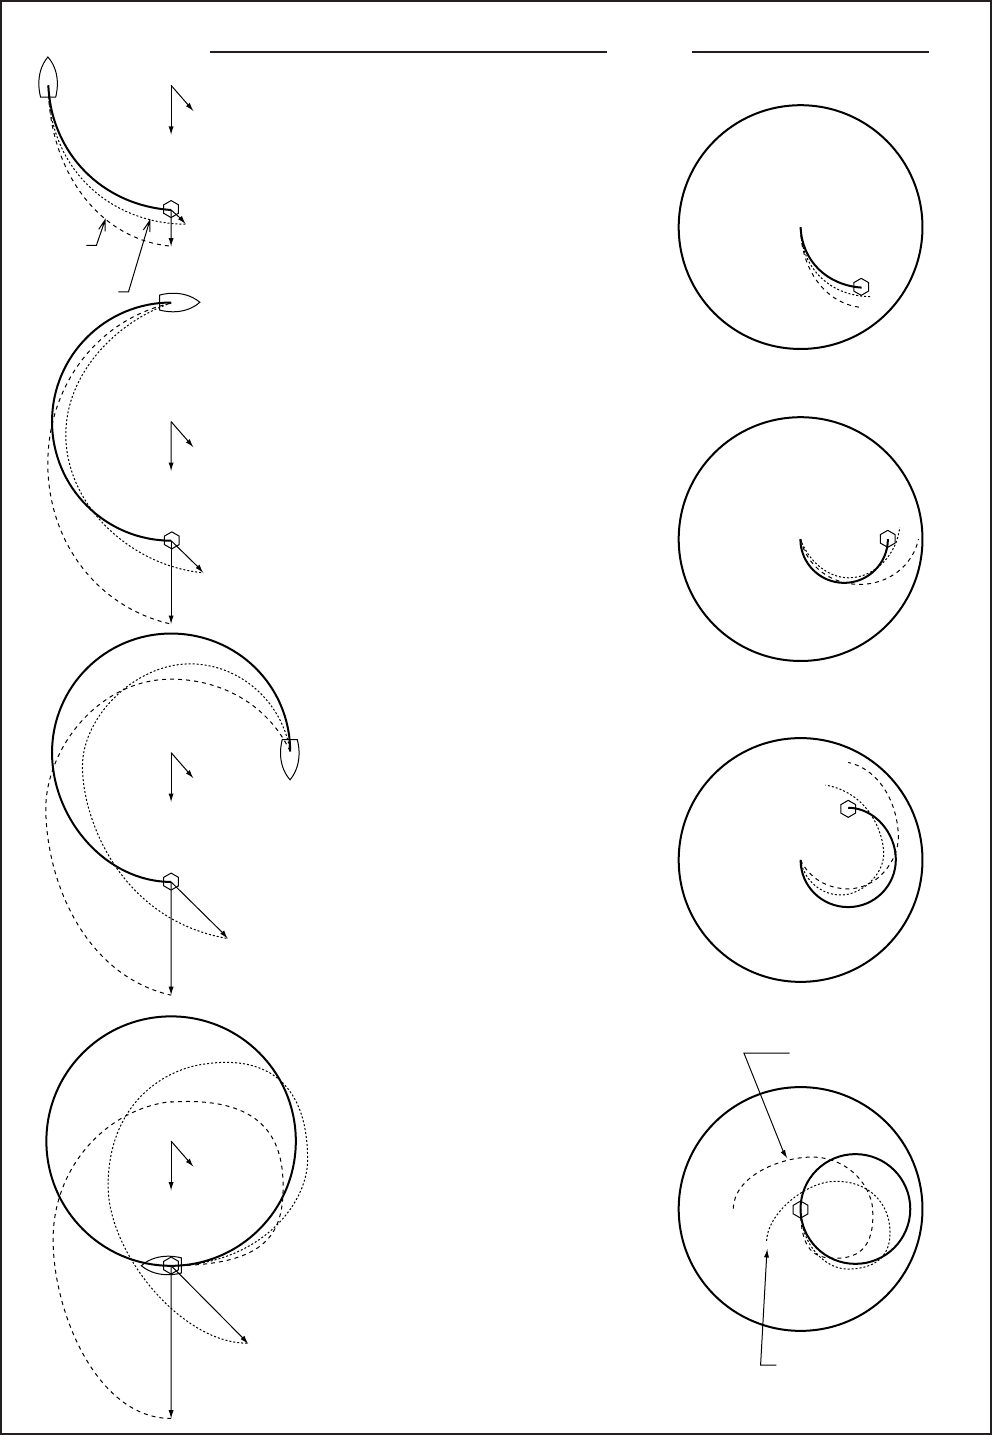
Example of tide effect plotting Display (Head-up)
Casting the first virtual
buoys at point “a”, vessel
made 1/4 of a circle and
reached point “b”.
Assume that each buoy
moves on each layer keep-
ing the same speed and di-
rection as at time of
measurement.
As time passes, the first
buoys should move as lows:
` c → c1 → c2 → c3:
(Layer 1)
` d → d1 → d2 → d3:
(Layer 2)
If the above situation is pre-
sented in the head-up mode,
the display will change as
shown right.
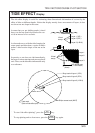
If there is no tidal move-
ment, the ship’s course and
the buoy tracks will coin-
cide.
If all layers are moving at
the same speed and direc-
tion, buoy tracks of all lay-
ers should coincide.
Tide of layer 2
Tide of layer 1
a
b
c
d
Buoy track
of layer 1
Buoy track
of layer 2
c1
d1
c2
d2
c3
d3
Current Ship's
position always at
screen center.
Buoy track of layer 1
Buoy track of layer 2