


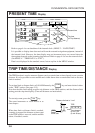
3-11
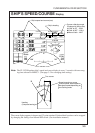
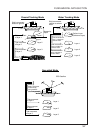
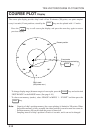
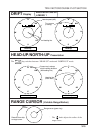
TIDE VECTOR/COURSE PLOT SECTION
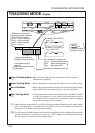
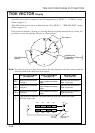
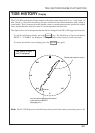
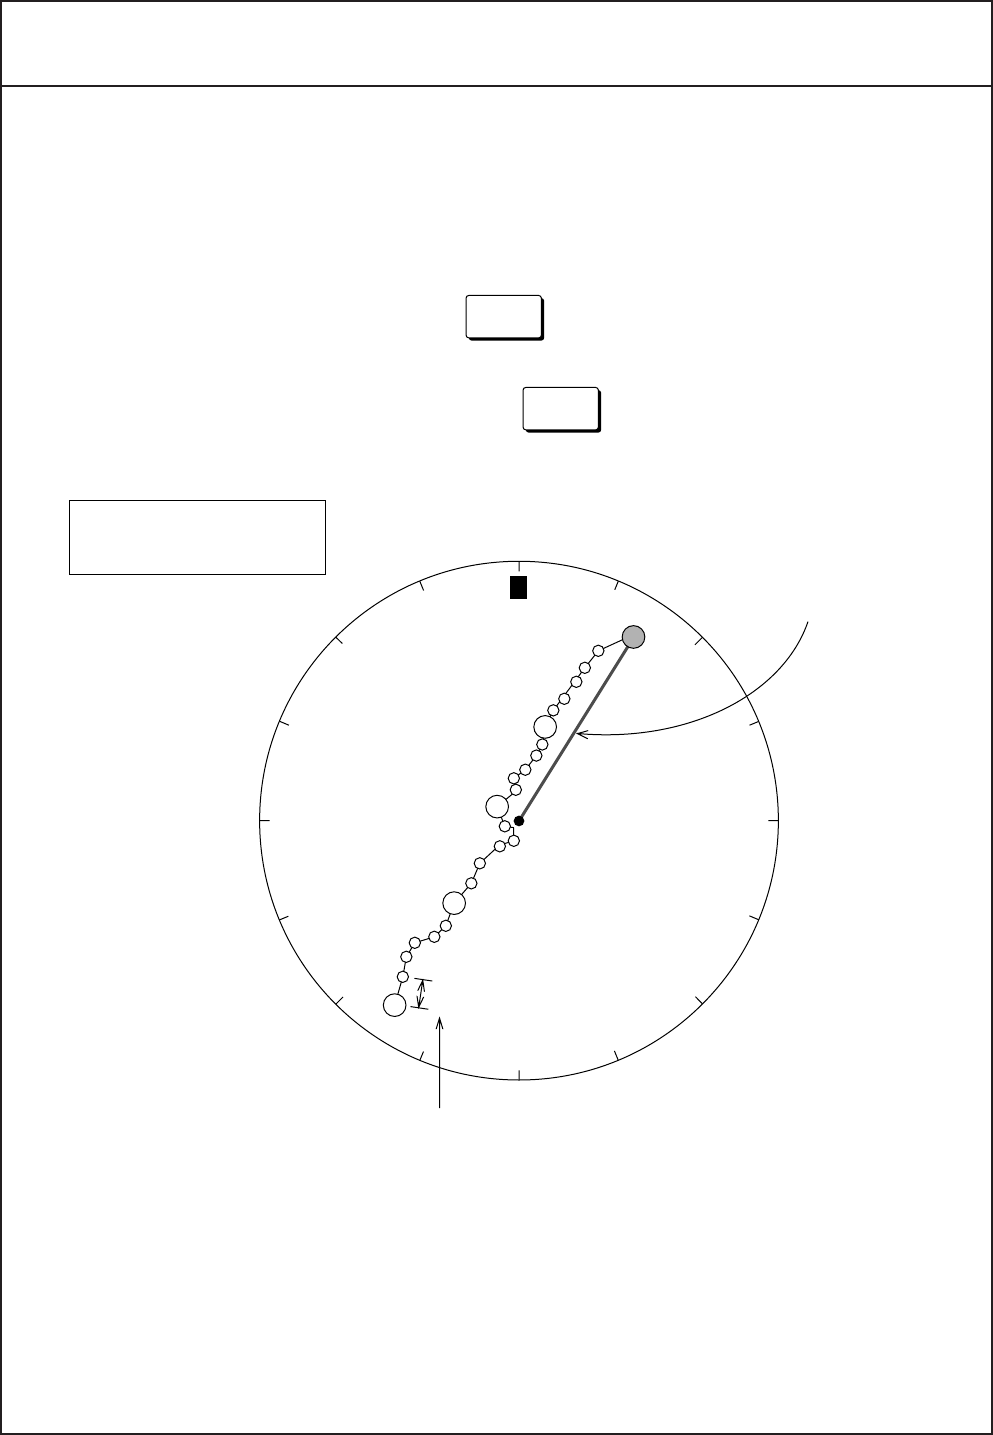
TIDE HISTORY Display
The CI-35/35H can hold last 24 tide samples collected at a time interval of 15 sec, 1 min, 5 min, 10
min, 30 min or 1 hour. The tide history presents variation of these tide information with a string of
round marks. That is, distance from the graphic center to a mark represents tide speed at the sample
time, and the direction from the center to a mark represents tide direction.
The figure below can be interpreted that the tide has changed from SW to NE (opposite) direction.
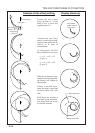
` To call the tide history display, press the
HISTORY
key. The tide history of layers activated in
MENU 1 - “LAYER n” are displayed. (The figure below shows history of only one layer.)
` To restore normal tide vector display, press the
HISTORY
key again.
Note: The CI-35/35H preserves the tide history data stored in the memory when the power is off.
N
W
E
S
NW
NE
SW
SE
Interval
You can select sampling time interval
of tide history in MENU 1.
(See page 4-2.)
Present tide vector for layer 1
Tide history of layer 1
(last 24 samples)