


74
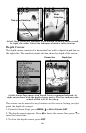
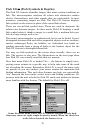
Red signals are much larger fish, or fish that are in the center of the
sonar cone, almost directly below the transducer. They return the
strongest echoes.
Signals that are yellow and some other color result from mid-sized fish
that are in a transition zone between the center and outer edges of the
sonar cone. They represent medium-strong echoes.
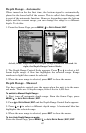
As a fish moves through part of the signal cone, the signal may change
from black to blue to green or yellow then back again. The signals may
appear to move up slightly and then back down, even if the fish doesn't
actually change depth. This is caused by the relative distance from the
transducer to the fish as it passes by the transducer.
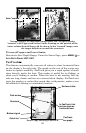
Signal band thickness
Simply put, smaller fish return smaller echoes that result in thinner
and fainter signal bands. A thin signal can also indicate a fish located
toward the outer edge of the signal cone. As fish size increases, the ech-
oes grow stronger and the signal band grows wider. Signal width also
increases as a fish approaches the center of the sonar cone.
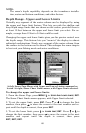
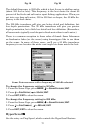
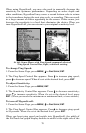
Log Sonar Chart Data
If you have an MMC installed in the unit, the sonar data shown on the
screen can be saved to the MMC. This can be played back at any time
(to play a recorded sonar chart log, see the entry in this section for So-
nar Simulator). If you have a personal computer and Internet access,
visit our web site, www.lowrance.com, and download the free Sonar
Viewer and the emulator for your unit. These programs will allow you
to replay sonar logs on your personal computer.
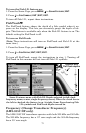
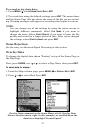
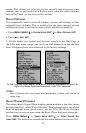
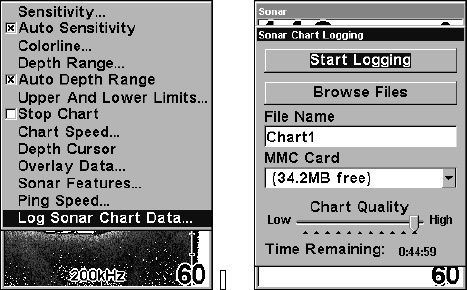
At left, the Sonar Page menu with the Log Sonar Chart Data command
selected. At right, Sonar Chart Logging menu, with the Start Logging
command selected. The menu says the MMC has 34.2 MB of free space,
which will record the scrolling chart for 44 minutes and 59 seconds.