


88
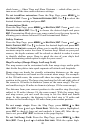
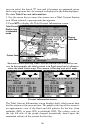
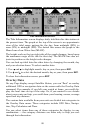
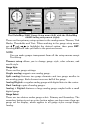
Tide Information screen.
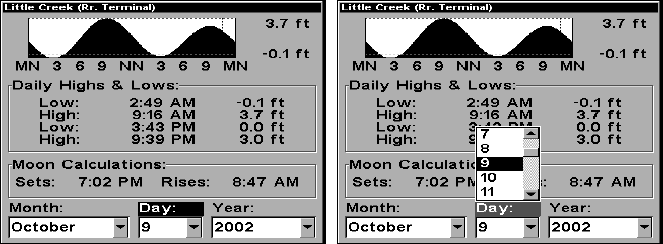
The Tide Information screen displays daily tidal data for this station at
the present time. The graph at the top of the screen is an approximate
view of the tidal range pattern for the day, from midnight (MN), to
noon (NN) to midnight (MN). The dotted line across the graph is the
Mean Lower Low Water line (MLLW).
The height scale on the top right side of the graph changes, based upon
the maximum range of the tide for that day. The MLLW line also ad-
justs its position as the height scale changes.
You can look up tidal data for other dates by changing the month, day
and year selection boxes. To select another date:
1. Use
→ and ← to highlight month, day or year, then press ENT.
2. Use ↑ and ↓ to select the desired month, day or year, then press ENT.
To clear the information screen, press EXIT.
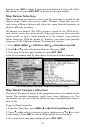
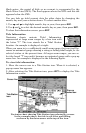
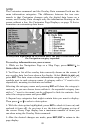
Overlay Data
On any Page display except Satellite Status, you can "float" or overlay
additional GPS or navigation data on the screen with the Overlay Data
command. For example, if you left your watch at home, you could dis-
play the local time on top of the map. Or, if you wanted to see details
about your route and trip, you could show your bearing, course, average
speed and trip distance.
The various data available from your unit are divided into categories in
the Overlay Data menu. These categories include GPS Data, Naviga-
tion, Trip Calculator and Time.
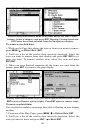
You can select items from any of these categories for display, in any
combination — the category divisions are there only to help you sort
through the information.