32
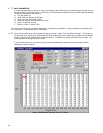
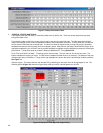
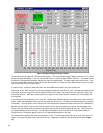
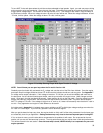
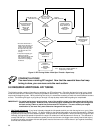
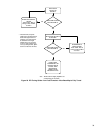
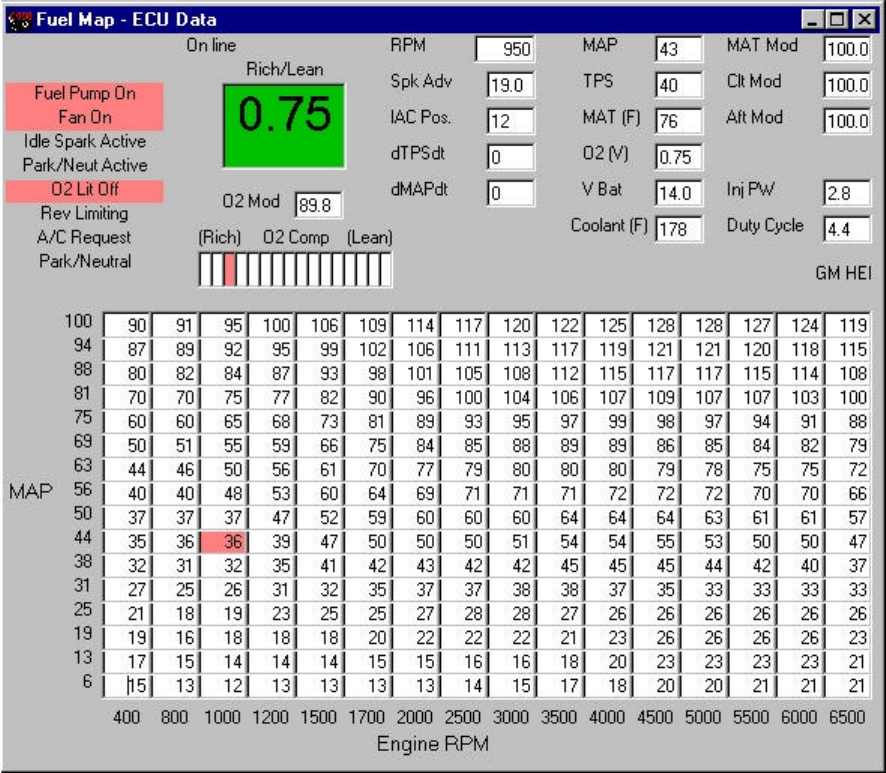
Figure 14 Engine Idling with Proper O
2
Mod
The number should be about 85 -100 when tuned properly. This means the base map is slightly richer than 14.7:1, which
will promote good driveability. If it is over 100 it is lean and if it is less than about 85-90 it is too rich. The software limits
the amount of compensation possible, although this value is programmable. The base maps have the limit set to +/-19%.
If the O
2
compensation number is fixed at 81(%) and does not move, it means the ECU needs to take out even more than
19% and the map is very rich at the point.
If it reads 118(%), it means it needs more than 18% fuel added and the map is very lean at that point.
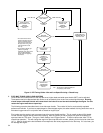
Start tuning at idle. With the engine running and operating closed loop, look at the O
2
mod. Increase or decrease the fuel
map values where the engine is running (the area will be red in the map). Don’t just do one cell, smooth the cells in the
surrounding area too. After idle is tuned, put the car in gear with your foot firmly on the brake (if it is an automatic) and
tune that point.
If your vehicle has air conditioning, turn it on at idle. Usually some additional tuning is necessary when the AC loads the
engine. Watch the highlighted area on the fuel map when the AC turns on. The load will increase and the rpm may drop
momentarily. You may need to richen the fuel map in the area that the load and rpm falls to when the AC is switched on.
After idle is tuned, take the car to a street with low traffic volume. Have one person drive the car and one person tune.
Drive the car at a steady speed and load and adjust the map until the O
2
Mod is between 85 and 100. Find hills to drive
up to get to different points on the map. You can apply the brakes for short times (as not to overheat the brakes) to
change the load. Change the gear the vehicle is in to get to different points on the map.
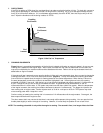
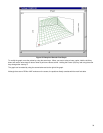
The map should be smooth and never have big spikes or dips. To check how smooth the map is, go to “Fuel” and “Fuel
Graph”. The graph will easily show if the map is smooth. Large dips or spikes can be corrected on the graph (Figure
15).


