


36 GPSMAP
®
400 Series Owner’s Manual
uSInG Sonar
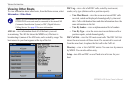
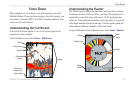
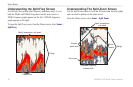
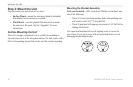
Understanding the Split Freq Screen
Use the Split Freq screen (dual frequency transducer only) to view
both the 50kHz and 200kHz frequencies on the same screen. A
50kHz frequency graph appears on the left; a 200kHz frequency
graph appears on the right.
To open the Split Freq screen, from the Home screen, select Sonar >
Split Freq.
Depth, temperature, and speed
Range
Frequencies
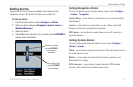
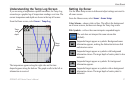
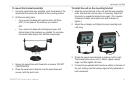
Understanding The Split Zoom Screen
Use the Split Zoom screen to view the full sonar data from the graph
and a zoomed in portion on the same screen.
From the Home screen, select Sonar > Split Zoom.
Transducer frequency
or beam width
Depth, temperature,
and speed
Range
Zoom
window
Zoomed
depth scale
Zoom level