


GPSMAP
®
400 Series Owner’s Manual 11
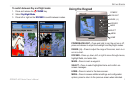
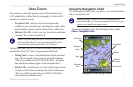
uSInG chartS
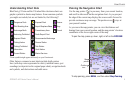
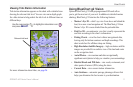
Viewing Tide Station Information
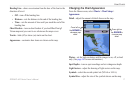
Tide station information appears on the chart with a detailed icon
showing the relevant tide level. You can view an in-depth graph
for a tide station to help predict the tide level at different times or
different days.
Use the map pointer ( ) to highlight a tide station icon ( ),
and press SELECT.
Relevant tide level
For more information about tides, see page 26.
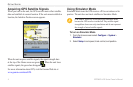
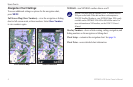
Using BlueChart g2 Vision
Optional BlueChart g2 Vision preprogrammed SD cards allow
you to get the most out of your unit. In addition to detailed marine
charting, BlueChart g2 Vision has the following features:
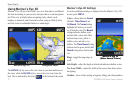
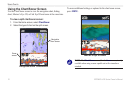
• Mariner’s Eye 3D—a bird’s eye view from above and behind the
boat, for a more visual navigation aid. The BlueChart g2 Vision
Mariner’s Eye 3D is more detailed than the preloaded data.
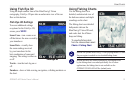
• Fish Eye 3D—an underwater view that visually represents the
seaooraccordingtothechart’sinformation.
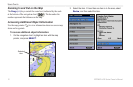
•
Fishing Charts—view the chart without navigational data,
leaving only the bottom contours and depth soundings. This
chartworksbestforoffshoredeep-seashing.
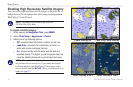
•
High Resolution Satellite Imagery—high resolution satellite
images are provided for a realistic view of the land and water
on the navigation chart.
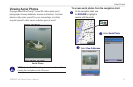
•
Aerial Photos—
view marinas and other navigationally
signicantaerialphotostohelpyouvisualizeyoursurroundings.
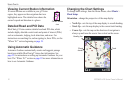
•
Detailed Roads and POI data—view roads, restaurants, and
other points of interest (POIs) along the shore.
•
Current Data—view current station information.
•
Auto Guidance—automatic passage planning software that
helps you determine the best course to your destination.