


19-20
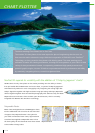
CHART PLOTTER
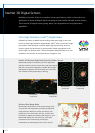
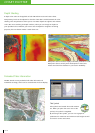
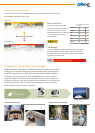
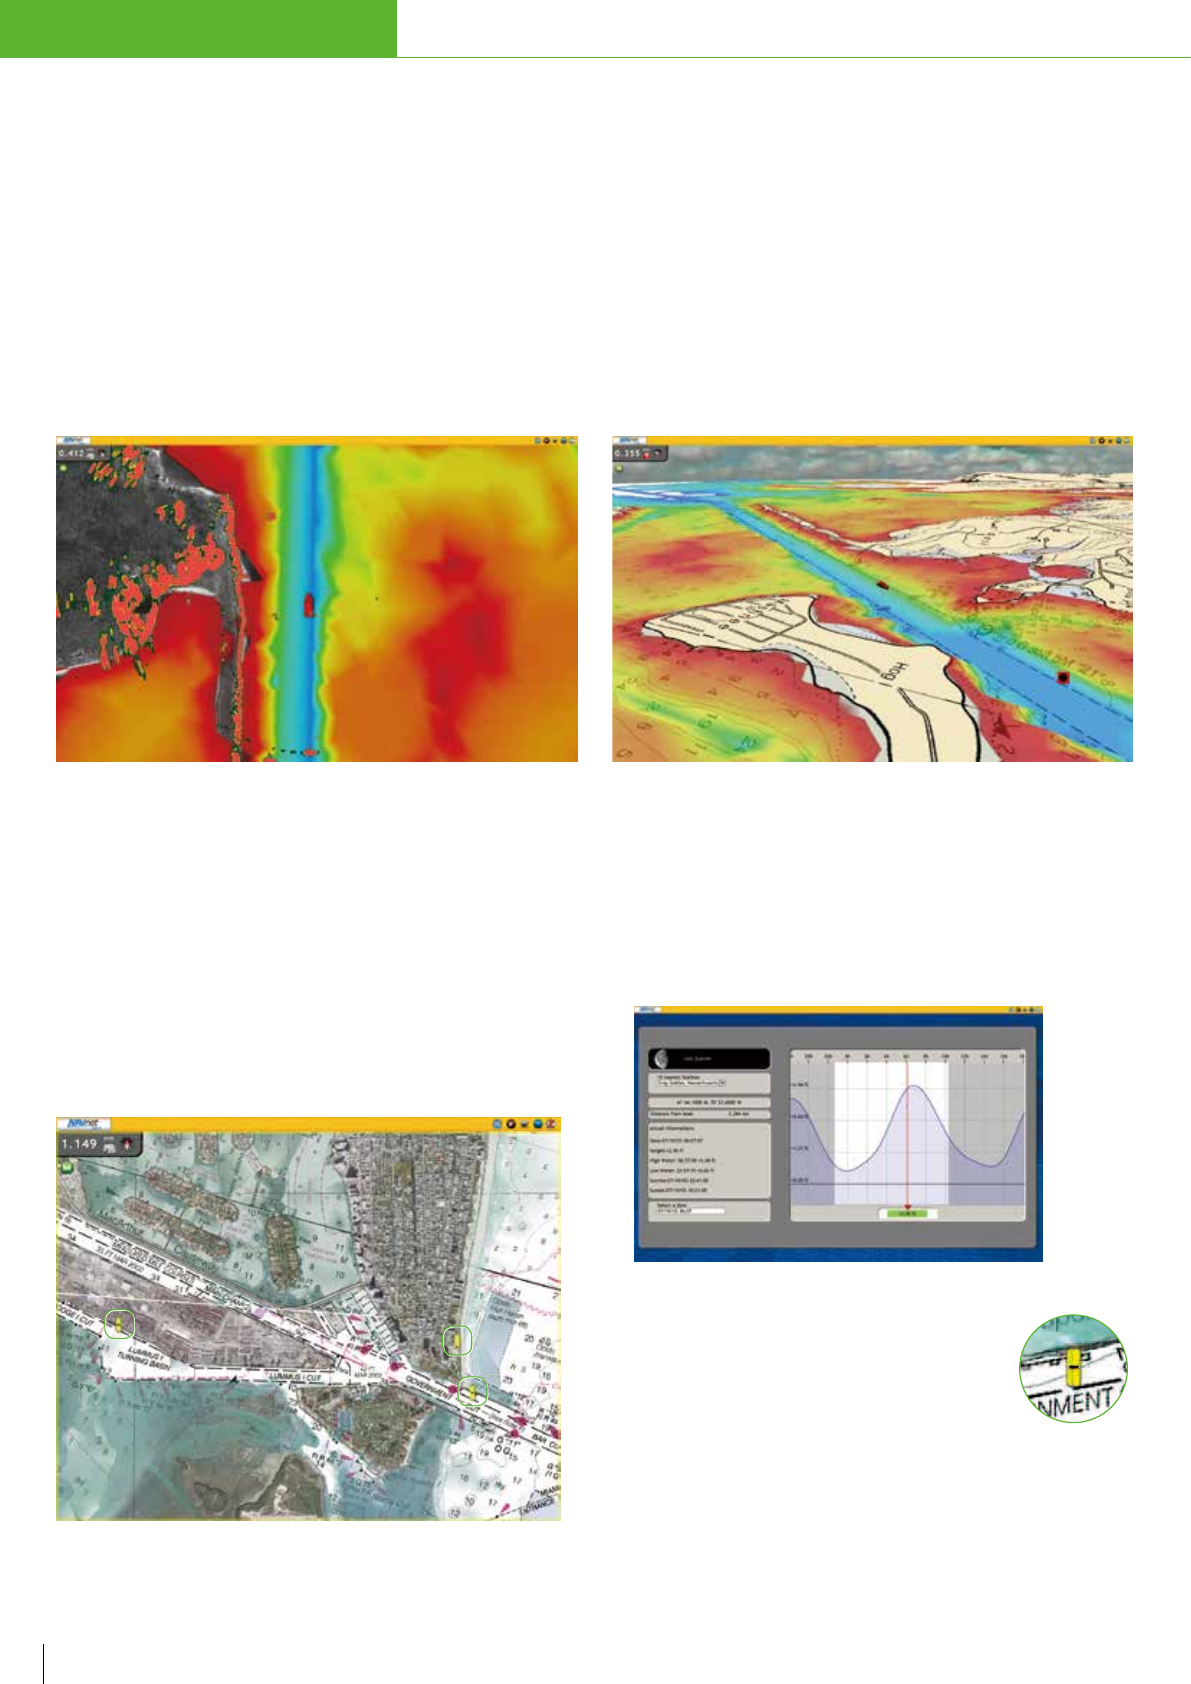
Depth Shading
A depth color scale can be applied on both 2D and 3D vector and raster charts.
Transparency levels can be adjusted so that the chart data is visible beneath the color
shading. This unique feature allows you to view water depths at-a-glance with vibrant
colors. No more searching for depth numbers, when you can simply set depths to
your specied colors. Whether you want to see the depth for navigation or shing
purposes, this new feature makes it easier than ever.
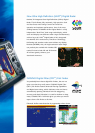
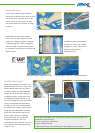
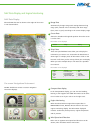
Preloaded Tides information
NavNet 3D also comes preloaded with tides information of
worldwide coverage, which can be overlaid with the chart display.
Tide Symbol
Tide symbols are located where tide stations
are. When you place the cursor over a tide
symbol, the symbol is magnied.
By selecting a tide symbol, you can view a graph for
predictions for maximum and minimum tide heights as well
as times for sunrise and sunset.
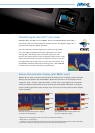
Bathymetric data is needed to display underwater presentation in 3D.
Bathymetric data is currently under development in some areas.
Please consult with the distributor in your area for availability.