


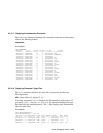
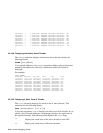
v0x81a0ab70 3 1 v0x819f1ce0 INSWAPPED v0x81a0af20 v0x81a0ad80 5276
v0x81a26b70 3 1 v0x819f1760 INSWAPPED v0x81a26f20 v0x81a26d80 5278
v0x819f2b70 3 1 v0x819f1e40 INSWAPPED v0x819f2f20 v0x819f2d80 5279
v0x81a14b70 3 1 v0x819f1b80 INSWAPPED v0x81a14f20 v0x81a14d80 5281
v0x81a3cb70 3 1 v0x819f11e0 INSWAPPED v0x81a3cf20 v0x81a3cd80 5287
v0x81a28000 3 1 v0x819f1550 INSWAPPED v0x81a283b0 v0x81a28210 5301
v0x819aab70 3 1 v0x808f71e0 INSWAPPED v0x819aaf20 v0x819aad80 195
v0x8197c000 3 1 v0x808f76b0 INSWAPPED v0x8197c3b0 v0x8197c210 6346
v0x819c4000 3 1 v0x808f6e70 INSWAPPED v0x819c43b0 v0x819c4210 204
.
.
.
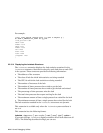
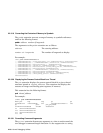
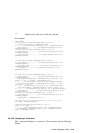
2.2.3.28 Displaying Information About Threads
The thread extension displays information about threads and has the
following format:
thread [ proc_address ]
If you specify addresses, the thread extensions displays thread structures
named by the addresses; otherwise, information about all threads is
displayed.
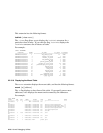
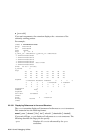
For example:
(kdbx) thread
Thread Addr Task Addr Proc Addr Event pcb state
=========== =========== =========== =========== =========== =====
v0x8644d690 v0x8637e440 v0x9041e830 v0x86420668 v0x90f50000 wait
v0x8644d480 v0x8637e1a0 v0x9041eec0 v0x86421068 v0x90f48000 wait
v0x863a17b0 v0x86380ba0 v0x9041db10 v0x8640e468 v0x90f30000 wait
v0x863a19c0 v0x86380e40 v0x9041d9c0 v0x8641f268 v0x90f2c000 wait
v0x8644dcc0 v0x8637ec20 v0x9041e6e0 v0x8641fc00 v0x90f38000 wait
v0x863a0520 v0x8637f400 v0x9041ed70 v0x8640ea00 v0x90f3c000 wait
v0x863a0310 v0x8637f160 v0x9041e980 u0x00000000 v0x90f44000 run
v0x863a2410 v0x863818c0 v0x9041dc60 v0x8640f268 v0x90f18000 wait
v0x863a15a0 v0x86380900 v0x9041d480 v0x8641ec00 v0x90f24000 wait
.
.
.
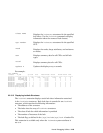
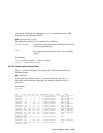
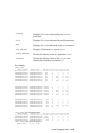
2.2.3.29 Displaying a Stack Trace of Threads
The trace extension displays the stack of one or more threads. This
extension has the following format:
trace [ thread_address
...
|
-k
|
-u
|
-a]
If you omit arguments, trace displays the stack trace of all threads. If you
specify a list of thread addresses, the debugger displays the stack trace of
the specified threads. The following table explains the trace flags:
−a
Displays the stack trace of the active thread on each CPU
−k
Displays the stack trace of all kernel threads
2–32 Kernel Debugging Utilities