


[0] 0xfffffc000065c580
[1] 0xfffffc000065c780
}
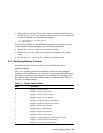
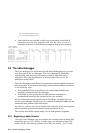
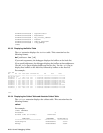
• Lock statistics are recorded to allow you to determine what kind of
contention you have on a particular lock. Use the kdbx lockstats
extension as shown in the following example to display lock statistics:
# kdbx /vmunix
(kdbx) lockstats
Lockstats li_name cpu count tries misses %misses waitsum waitmax waitmin trmax
=========== ===================== === ====== ========== ======= ====== ============ ======= ======= ======
k0x00657d40 inode.i_io_lock 1 1784 74268 1936 2.61 110533 500 6 10
k0x00653400 nfs_daemon_lock 0 1 7 0 0.00 0 0 0 0
k0x00657d80 nfs_daemon_lock 1 1 0 0 0.00 0 0 0 0
k0x00653440 lk_lmf 0 1 0 0 0.00 0 0 0 0
k0x00657dc0 lk_lmf 1 1 2 0 0.00 0 0 0 0
k0x00653480 procfs_global_lock 0 1 3 0 0.00 0 0 0 0
k0x00657e00 procfs_global_lock 1 1 5 0 0.00 0 0 0 0
k0x006534c0 procfs.pr_trace_lock 0 40 0 0 0.00 0 0 0 0
k0x00657e40 procfs.pr_trace_lock 1 40 0 0 0.00 0 0 0
2.2 The kdbx Debugger
The kdbx debugger is a crash analysis and kernel debugging tool; it serves
as a front end to the dbx debugger. The kdbx debugger is extensible,
customizable, and insensitive to changes to offsets and field sizes in
structures. The only dependencies on kernel header files are for bit
definitions in flag fields.
The kdbx debugger has facilities for interpreting various symbols and kernel
data structures. It can format and display these symbols and data structures
in the following ways:
• In a predefined form as specified in the source code modules that
currently accompany the kdbx debugger
• As defined in user-written source code modules according to a
standardized format for the contents of the kdbx modules
All dbx commands (except signals such as Ctrl/P) are available when you
use the kdbx debugger. In general, kdbx assumes hexadecimal addresses for
commands that perform input and output.
As with dbx, you can use kdbx to examine the call stack of the user program
whose execution precipitated a kernel crash (see Section 2.1.9).
The sections that follow explain using kdbx to debug kernel programs.
2.2.1 Beginning a kdbx Session
Using the kdbx debugger, you can examine the running kernel or dump files
created by the savecore utility. In either case, you examine an object file
and a core file. For running systems, these files are usually /vmunix and
2–12 Kernel Debugging Utilities