


struct timeval {
int tv_sec;
int tv_usec;
} it_value;
};
2.1.7 Debugging Multiple Threads
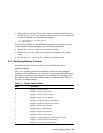
You can use the dbx debugger to examine the state of the kernel’s threads
with the querying and scoping commands described in this section. You
use these commands to show process and thread lists and to change the
debugger’s context (by setting its current process and thread variables)
so that a stack trace for a particular thread can be displayed. Use these
commands to examine the state of the kernel’s threads:
print $tid
Display the thread ID of the current
thread
print $pid
Display the process ID of the current
process
where
Display a stack trace for the current
thread
tlist
Display a list of kernel threads for the
current process
kps
Display a list of processes (not available
when used with kdebug)
set $pid=process_id
Change the context to another process (a
process ID of 0 changes context to the
kernel)
tset thread_id
Change the context to another thread
tstack
Displays the stack trace for all threads.
2.1.8 Examining the Exception Frame
When you work with a crash dump file to debug your code, you can use
dbx to examine the exception frame. The exception frame is a stack frame
created during an exception. It contains the registers that define the state
of the routine that was running at the time of the exception. Refer to the
Kernel Debugging Utilities 2–7