


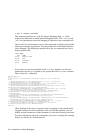

______________________ Note _______________________
Starting with Tru64 UNIX Version 5.0, all the previously
mentioned tools can be used with compressed (vmzcore.n) and
uncompressed (vmcore.n) crash dump files. Older versions of
these tools can read only vmcore.n files. If you are using an
older version of a tool, use the expand_dump utility to produce
a vmcore.n file from a vmzcore.n file. For more information
about compressed and uncompressed crash dump files, see
expand_dump
(8) and the System Administration manual.
2.1 The dbx Debugger
The dbx debugger is a symbolic debugger that allows you to examine,
modify, and display the variables and data structures found in stripped or
nonstripped kernel images.
The following sections describe how to invoke the dbx debugger for kernel
debugging (Section 2.1.1) and how to use its commands to perform tasks
such as the following:
• Debugging stripped images (Section 2.1.2)
• Specifying the location of loadable modules for crash dumps
(Section 2.1.3)
• Examining memory contents (Section 2.1.4)
• Displaying the values of kernel variables, and the value and format of
kernel data structures (Section 2.1.5)
• Displaying the format of a data structure (Section 2.1.6)
• Debugging multiple threads (Section 2.1.7)
• Examining the exception frame (Section 2.1.8)
• Examining the user program stack (Section 2.1.9)
• Extracting the preserved message buffer (Section 2.1.10)
• Debugging on SMP systems (Section 2.1.11)
For more information on dbx, see the Programmer’s Guide.
2.1.1 Invoking the dbx Debugger for Kernel Debugging
To debug kernel code with the dbx debugger, you use the −k flag. This flag
causes dbx to map memory addresses. When you use the dbx −k command,
the debugger operates on two separate files that reflect the current state of
the kernel that you want to examine. These files are as follows:
• The disk version of the executable kernel image
2–2 Kernel Debugging Utilities