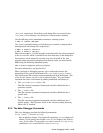
/dev/mem, respectively. By default, crash dump files are created in the
/var/adm/crash directory (see the System Administration manual).
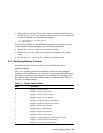
Use the following kdbx command to examine a running system:
# kdbx −k /vmunix /dev/mem
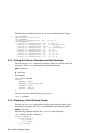
Use a kdbx command similar to the following to examine a compressed or
uncompressed crash dump file, respectively:
# kdbx −k vmunix.1 vmzcore.1
# kdbx −k vmunix.1 vmcore.1
The version number (.1 in this example) is determined by the value contained
in the bounds file, which is located in the same directory as the dump files.
To examine a crash dump file and also view the call stack of the user
program whose execution precipitated the kernel crash, you must invoke
kdbx using the following command syntax:
kdbx -k vmunix.
n vm[z]core.n path/user-program
For more information, see Section 2.1.9.
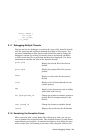
When you begin a debugging session, kdbx reads and executes the
commands in the system initialization file /var/kdbx/system.kdbxrc.
The initialization file contains setup commands and alias definitions. (For
a list of kdbx aliases, see the kdbx
(1) reference page.) You can further
customize the kdbx environment by adding commands and aliases to:
• The /var/kdbx/site.kdbxrc file
This file contains customized commands and alias definitions for a
particular system.
• The ~/.kdbxrc file
This file contains customized commands and alias definitions for a
specific user.
• The ./.kdbxrc file
This file contains customized commands and alias definitions for a
specific project. This file must reside in the current working directory
when kdbx is invoked.
2.2.2 The kdbx Debugger Commands
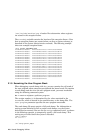
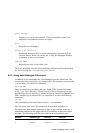
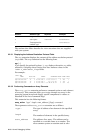
The kdbx debugger provides the following commands:
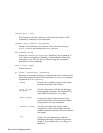
alias [name] [command-string]
Sets or displays aliases. If you omit all arguments, alias displays all
aliases. If you specify the variable name, alias displays the alias for
name, if one exists. If you specify name and command-string, alias
establishes name as an alias for command-string.
Kernel Debugging Utilities 2–13


