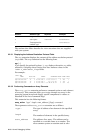
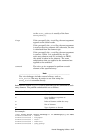
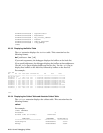
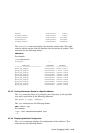
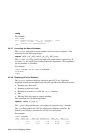
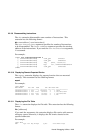
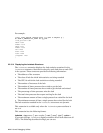
For example:
(kdbx) list_action "struct proc *" p_nxt 0 allproc p \
%c.task.u_address.uu_comm %c.p_pid
"list_action" 1382
"dbx" 1380
"kdbx" 1379
"dbx" 1301
"kdbx" 1300
"sh" 1296
"ksh" 1294
"csh" 1288
"rlogind" 1287
.
.
.
2.2.3.14 Displaying the lockstats Structures
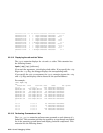
The lockstats extension displays the lock statistics contained in the
lockstats structures. Statistics are kept for each lock class on each CPU
in the system. These structures provide the following information:
• The address of the structure
• The class of lock for which lock statistics are being recorded
• The CPU for which the lock statistics are being recorded
• The number of instances of the lock
• The number of times processes have tried to get the lock
• The number of times processes have tried to get the lock and missed
• The percentage of time processes miss the lock
• The total time processes have spent waiting for the lock
• The maximum amount of time a single process has waited for the lock
• The minimum amount of time a single process has waited for the lock
The lock statistics recorded in the lockstats structures are dynamic.
This extension is available only when the lockmode system attribute is
set to 4.
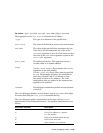
This extension has the following format:
lockstats -class name
|
-cpu number
|
-read
|
-sum
|
-total
|
-update n
If you omit all flags, lockstats displays statistics for all lock classes on all
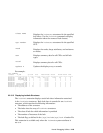
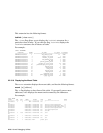
CPUs. The following describes the flags you can use:
2–24 Kernel Debugging Utilities


