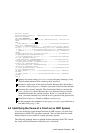
c3200]
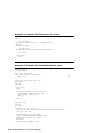
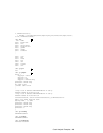
(kdbx) q
dbx (pid 29939) died. Exiting...
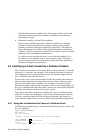
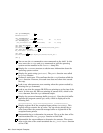
1 Use the sum command to get a summary of the system.
2 Display the panic string (panicstr).
3 Perform a stack trace of the current thread block. The stack trace shows
that the direnter function, at line 986 in file ufs_lookup.c, called
the panic function.
4.3 Identifying a Hardware Exception
Occasionally, your system might crash due to a hardware error. During a
hardware exception, the hardware encounters a situation from which it
cannot continue. For example, the hardware might detect a parity error in
a portion of memory that is necessary for its successful operation. When a
hardware exception occurs, the hardware stores information in registers and
stops operation. When control returns to the software, it normally calls the
panic function and the system crashes.
The sections that follow show how to identify hardware traps using the
dbx and kdbx debuggers. You can also examine output from the crashdc
crash data collection tool to help you determine the cause of a crash. Sample
output from crashdc is shown and explained in Appendix A.
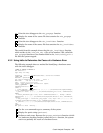
4.3.1 Using dbx to Determine the Cause of a Hardware Error
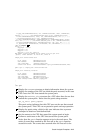
The following example shows a method for identifying a hardware trap with
the dbx debugger:
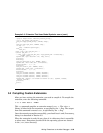
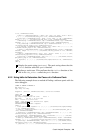
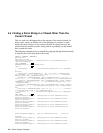
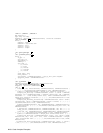
# dbx -k vmunix.1 vmzcore.1
dbx version 5.0
Type ’help’ for help.
(dbx) sh strings vmunix.1 | grep ’(Rev’
1
Tru64 UNIX V5.0-1 (Rev. 961); Wed Mar 18 16:12:36 EST 1999
(dbx) p utsname
2
struct {
sysname = "OSF1"
nodename = "system.dec.com"
release = "V5.0"
version = "961"
machine = "alpha"
}
(dbx) p panicstr
3
0xfffffc0000489350 = "trap: Kernel mode prot fault\n"
(dbx) t
4
> 0 boot(paniced = 0, arghowto = 0) ["/usr/sde/alpha/build/alpha.nightly/src/ker\
nel/arch/alpha/machdep.c":
1 panic(s = 0xfffffc0000489350 = "trap: Kernel mode prot fault\n") ["/usr/sde\
/alpha/build/alpha.nightly/src/kernel/bsd/subr_prf.c":1099, 0xfffffc00002c0730]
2 trap() ["/usr/sde/alpha/build/alpha.nightly/src/kernel/arch/alpha/trap.c":54\
4–4 Crash Analysis Examples


