


17
EXPLORING THE PAGES : ELEVATION
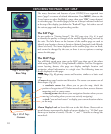
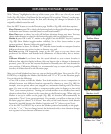
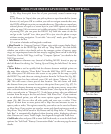
With “History” highlighted at the top of the screen, press OK to see a list of your stored
Trails (Fig. 21). Select a Trail from the list and press OK to replace “History” on the page-
you now see the elevation history for that trail, showing the changes in altitude as you
originally walked/created the trail.
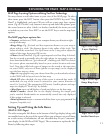
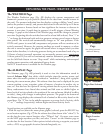
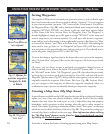
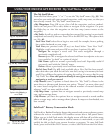
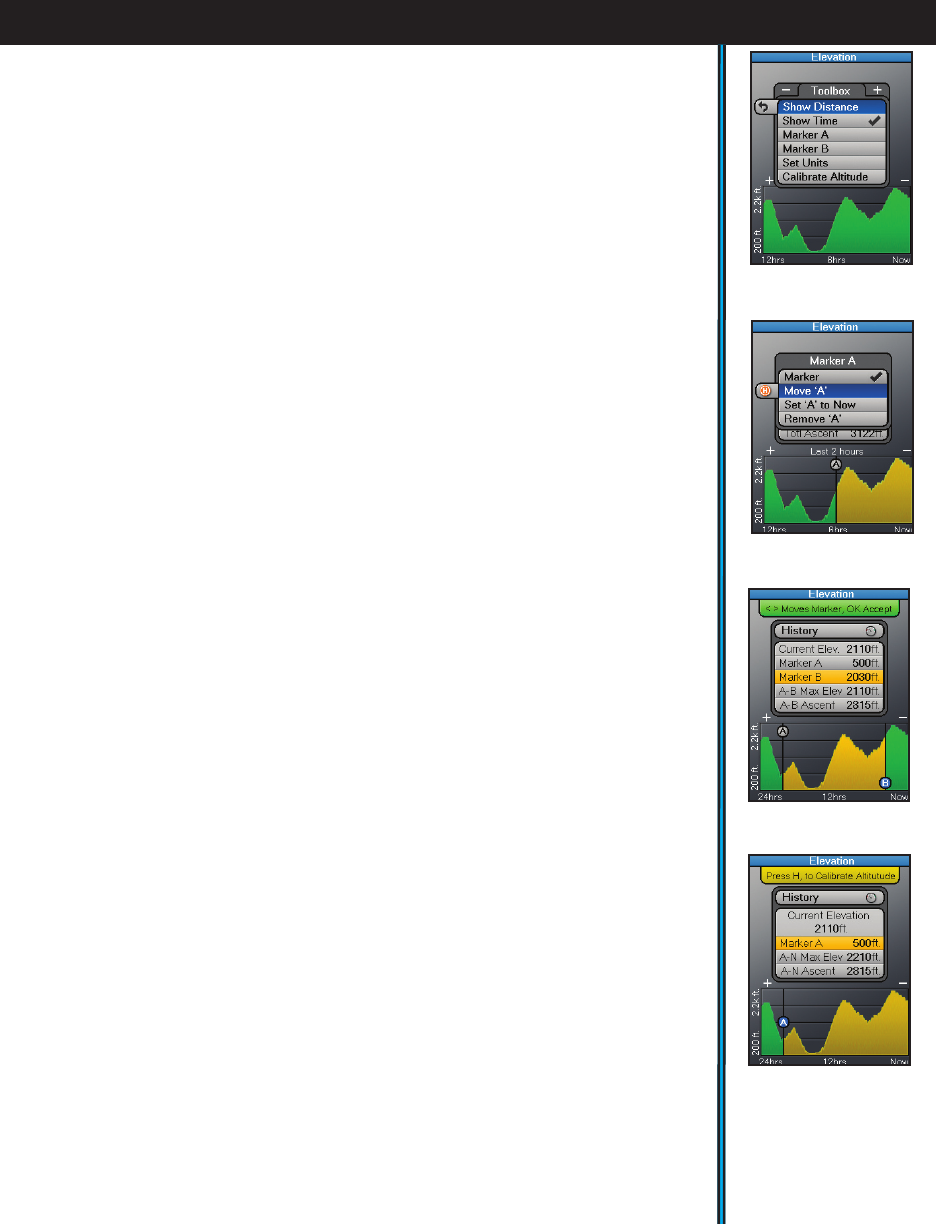
Press the HOT button to see the Elevation page ToolBox (Fig. 22), with these options:
Show Distance-press OK to check, the horizontal scale on the graph will represent change
in elevation over distance traveled (based on trail breadcrumbs).
Show Time-same as above, but scale will indicate elevation change over time. You may
choose either distance or time for the horizonal graph scale but not both at once.
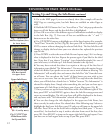
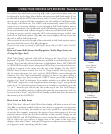
Marker A-press OK to add “A” marker to the graph. Press the RIGHT key for 3 options
(Fig. 23): Show Marker (toggles marker visibility), Set to Now (resets marker to your
current position), Remove (deletes the graph marker).
Marker B-same as above, for Marker “B”. Add this second marker to compare elevation
differences between two points in time or distance on a trail.
Set Units-pressing OK temporarily jumps to the SET page so you can choose your
preferences for distance and altitude units (kilometers or statute miles, feet or meters,
etc).
Calibrate Altitude-if you know that the actual altitude at your current location is
different than what the display indicates (this can happen due to changes in barometric
pressure), press OK to use the onscreen keyboard to manually enter the true altitude for
your position. Calibrating Altitude is a recommended step to ensure the best possible
accuracy of all data shown on the Elevation page.
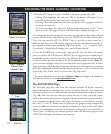
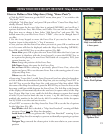
After one or both Markers have been set, you can freely modify them. First, press the UP or
DOWN key to highlight the Marker (dot labeled with “A” or “B”) on the elevation graph.
You can then do the following:
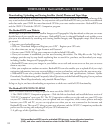
• Press OK to show or hide the Marker. Turn both markers on to see a comparison in
altitiude between two different locations separated by distance or time (Fig. 24), for
example, two rest points where you stopped on a mountain climbing trail a few hours
apart. Or, turn on only one marker to compare another point in distance or time with
“Now” (your current position). Turning one or both markers on or off affects how much
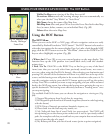
elevation related data is shown in the center box on the Elevation page. When only one
Marker is set up or visible on the graph (Fig. 25), it’s elevation will automatically be
compared to “Now” (your current position). For example, you will see a data row in the
Elevation page box named “A-N Ascent” that tells you the total distance (with altitude
factored in) traveled between the Marker A position and “N” (where you are Now).
• Use the LEFT or RIGHT key to move the Marker position horizontally on the graph
• Use the “+” or “-” keys to change (zoom) the horizontal scale to view elevation changes
over a greater or lesser amount of distance or time.
Fig 23.
Elevation:
Options-Marker A
Fig 22.
Elevation:
Toolbox Menu
Fig 24.
Elevation:
Marker A vs B
Fig 25.
Elevation:
Marker A vs “Now”