


15
EXPLORING THE PAGES : WEATHER / ALMANAC
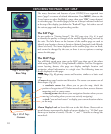
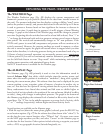
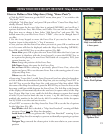
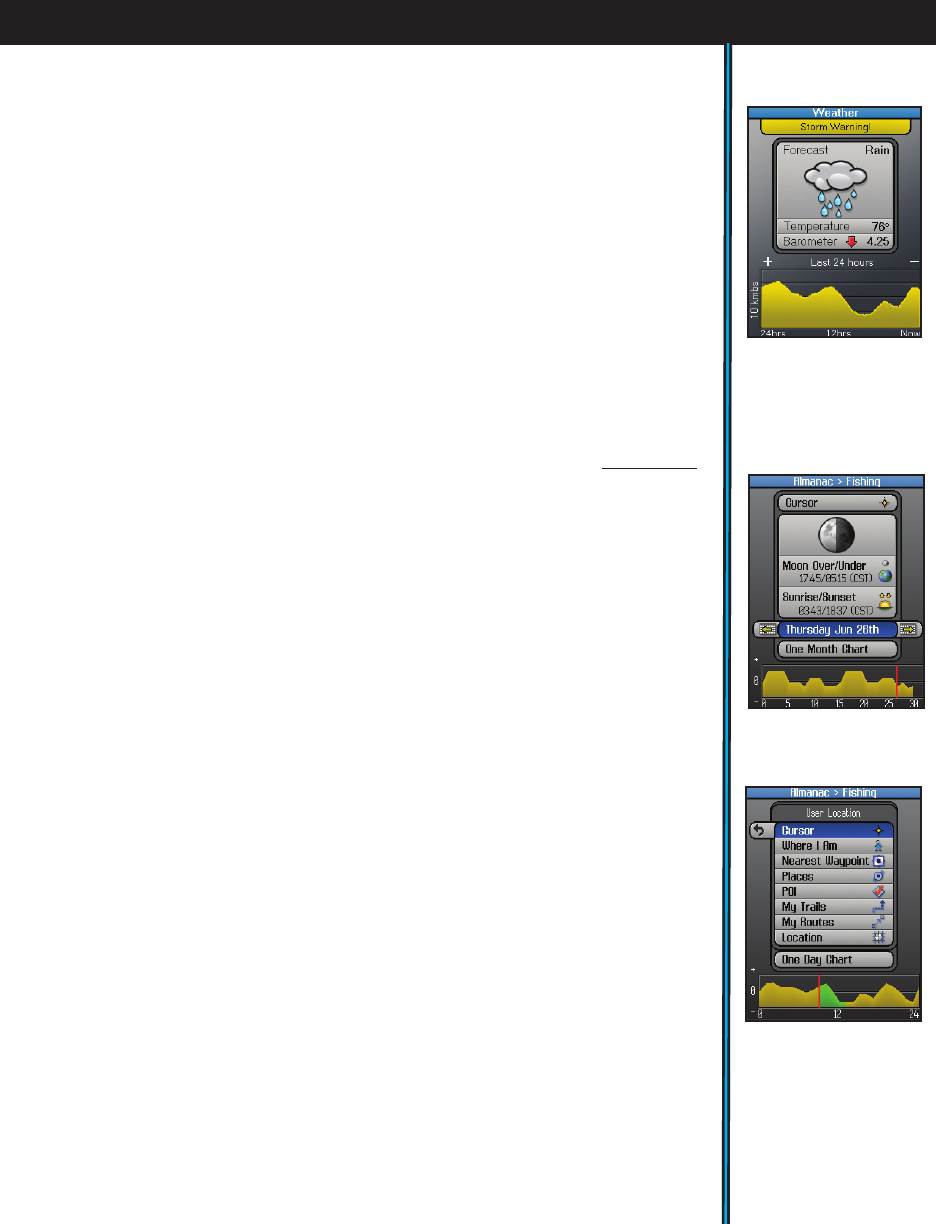
e WEATHER Page
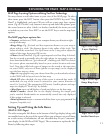
e Weather Prediction page
(Fig. 15)
displays the current temperature and
barometric pressure at your position (based on the data from internal sensors in
the unit). e pressure indication box also displays a rising or falling “trend” arrow
(unless the pressure is steady), and pressure data stored in the unit for up to 24 hours
is used to generate a forecast based on how significant the increase or decrease in
pressure is over time. A rapid drop in pressure (>6 mB) triggers a Storm Warning
message. A graph at the bottom of the Weather page tracks the change in pressure
over time (beginning after the unit has been on for at least half an hour). Press “+” or
“-” to change the horizontal scale and view presssure variance over a longer or shorter
time period. e vertical scale automatically changes to “fit” max presssure. If the
ONIX unit’s power is turned off, temperature and pressure will not continue to be
actively measured. However, the pressure readings are stored in memory, so when
the unit is turned on again, the graph will resume where it stopped when you shut
down before-therefore, it is showing pressure during an accumulated total of up to
24 hours of active (powered) operation, not necessarily pressure over a continuous
24 hour period. If you wish to continuously monitor barometric pressure, you can
use the SafeTrack feature to enter “sleep mode” while maintaining uninterrupted
weather sensor operation with minimized battery drain.
No HOT button menu is available for the Weather page.
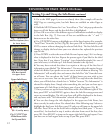
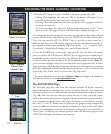
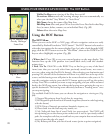
e ALMANAC Page
e Almanac page
(Fig. 16)
primarily is used to view the information stored in
internal Solunar Edge* data tables, which includes times for sunrise, sunset, and
times when the moon’s position is overhead or “underfoot”, along with a graphic
showing the current moon phase. is solunar chart data can be displayed for your
current position, or any waypoint, point of interest, a location in another city or
state, etc. You also have the option of viewing solunar data for a past or future date.
Many outdoorsmen have found that animals and fish seem to exhibit higher or
lower levels of activity related to the position of the sun and moon (think of its effect
on tides) , along with changes in atmospheric pressure. e graph at the bottom of
the Almanac page displays the estimated level of animal or fish activity based on the
stored data. e “0” line in the middle represents an average level of activity, while
“+” or “-” readings (respectively) indicate higher and lower activity levels.
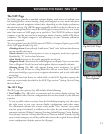
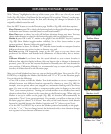
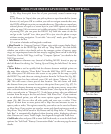
Several options are available on the Almanac page:
• With the top box (above the moon phase graphic) selected, press the RIGHT key
to see location options
(Fig. 17)
for the solunar data (data shown is for “where”?). To
see the data for your current location, select “Where I Am”. Or, move your cursor
on the MAP page anywhere you like, and select “Cursor” on the Almanac page to
see the data for that location. Other options include selecting a waypoint you stored
earlier, a POI, any geographic location (latitude/longitude), etc.
Fig 16. Almanac
Page (Date Selected)
Fig 17. Almanac
Page (Location
Options)
Fig 15. Weather
Page
Note falling barometer
and Storm Warning