


2. WINDOW DISPLAYS
2-14
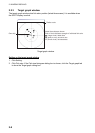
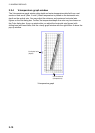
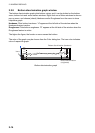
2.2.8 Bottom discrimination graph window
The bottom discrimination graph plots bottom nature, and it can be plotted on the bottom
zoom, bottom lock and zoom marker windows. Right click one of those windows to show a
pop-up menu, and choose (check) Hardness and/or Roughness from the menu to show
respective graph.
Hardness: Plots bottom hardness. “H” appears at the left side of the window when the
Hardness feature is active.
Roughness: Plots bottom roughness. “R” appears at the left side of the window when the
Roughness feature is active.
The higher the figure, the harder or more uneven the bottom.
The color of the graph may be chosen from the Color dialog box. The icon color indicates
color of respective graph.
Icons
10
8
6
4
2
0
10.0
8.0
6.0
4.0
2.0
0.0
H
R
Bottom discrimination (hardness)
Bottom discrimination
(roughness)
Bottom discrimination graph