


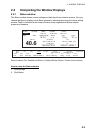

2. WINDOW DISPLAYS
2-7
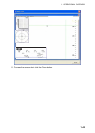
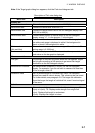
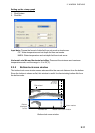
Note: If the Target graph dialog box appears, click the Fish size histogram tab.
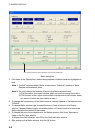
Description of Fish size dialog box
Menu item Description
Display tab
Horizontal axis scale
Choose the horizontal axis scale, from 10-100(%).
Vertical axis area Choose the vertical axis scale from 1-6.
Vertical zoom rate Choose the vertical zoom rate for the fish histogram display from
100, 200 or 400(%).
Vertical zoom area Choose center position of vertical zoom on the fish histogram
display among 1-7. 1 is the shortest, 7 is the longest.
White mark Turn the white mark on or off. When turned on, the bar graph within
the white mark range is displayed in white if the background is
black, or black if the background is white.
White mark area
(Min and Max)
Choose the minimum and maximum range of the white mark. The
setting range is 2-1000(cm)
Peak Turn peak display on or off. When turned on, the representative
peak value on the bar graph is displayed.
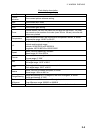
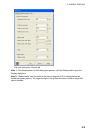
Measurement tab
Fish gain The strength of the returning echo varies with fish species. Adjust
the fish gain according to fish species to get actual fish length
distribution on the fish histogram display.
Measurement threshold Set measurement threshold (2-20(cm)) for the fish histogram
display. For example, if you do not want to measure fish less than
10 cm in length, enter 10.
Calibration value Set TS (echo strength of individual fish) value. If a calibration
sphere was used its value is shown. This value may be fine tuned.
For further details, see paragraph 3.8. The larger the calibration
figure the longer the length of individual fish, even if received signal
is the same.
Unit tab
Unit Choose the unit of measurement for the fish size histogram; TS or
L(cm) or L(inch). TS: Displays echo strength from single fish.
L(cm): Displays fish length in centimeters.
L(inch): Displays fish length in inches.