


2. WINDOW DISPLAYS
2-10
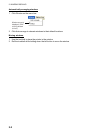
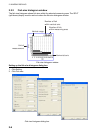
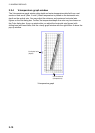
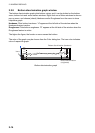
2.2.4 V-temperature graph window
The V-temperature graph window plots depth and water temperature data fed from a net
sonde or trawl sonar. (Max. 6 units.) Water temperature is plotted on the horizontal axis;
depth on the vertical axis. You may adjust the minimum and maximum horizontal axis
figures on the Net dialog box. Further, the temperature/depth line color may be chosen on
the Color dialog box. A pop-up window lets you adjust the horizontal axis figures (with
sliding bars) and reset data; click the v-temp graph window with the right button to show the
pop-up window.
Horizontal axis
(temperature)
Horizontal axis
(depth)
V-temperature graph