


2. WINDOW DISPLAYS
2-8
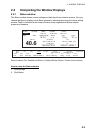
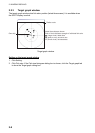
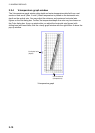
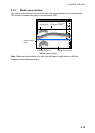
2.2.3 Target graph window
The target graph window plots fish echo position (latest three scans). It is available when
the SPLIT display is active.
Radius scale
Latest three data are shown.
Color of circle indicates strength of individual fish echo.
(Large circle): latest data
(Small circle): 3rd latest data
(Medium circle): 2nd latest data
Own ship
Target graph
Target graph window
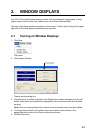
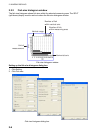
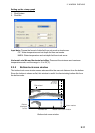
Setting up the target graph window
1. Click Setting.
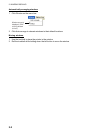
2. Click Fish size. If the Fish size histogram dialog box is shown, click the Target graph tab
to show the Target graph dialog box.