


1. OPERATIONAL OVERVIEW
1-19
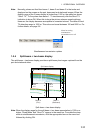
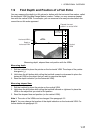
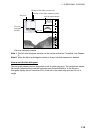
Area of measurement
Number of fish within measuring area
Vert. axis
Number of fish within vertical axis
20
40
60
80
0
40
00:00:28
34 42.616' N
135 19.740' E
125/247
Hor. axis
Fish size
histogram
window
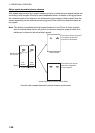
Fish size histogram window
Note 1: The fish size histogram window can be moved as desired. For details, see Chapter
2.
Note 2: When the fish size histogram window is closed, all data measured is deleted.
How to read the fish histogram
The bar graph shows size and proportion of fish in measuring area. The vertical axis shows
fish length (default setting) and the horizontal axis shows distribution. In the fish size
histogram display above, more than 50% of the fish in the measuring area are 10 cm in
length.