


Instruction Manual MM850481 ed.01
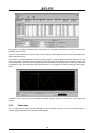
The operator can change the measuring units, the fuel type, etc. The program will made the conversion in real time and
will display the new values.
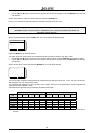
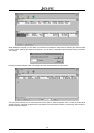
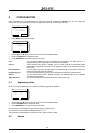
A set of 4 buttons allows you to set the printer, to print measures, export measures using an Excel compatible format,
show or hide the columns.
A fifth button is normally disabled and it allows to display graphics. To display graph, you have to select one or more
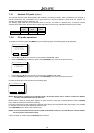
columns for graphics. Select the column by positioning the mouse pointer on the desired column header and click, using
the mouse left button; click using the mouse right button and select the “Select for graph” option. The column header will
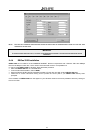
be displayed in Italic. The “Show graph” button became active. You can display the graph by pressing the “Show graph”
button.
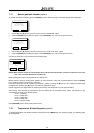
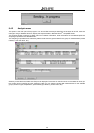
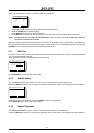
Activate the cursor and snap cursor to the desired parameter. Using the mouse you can move the cursor amongst the
measure.
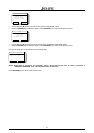
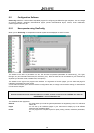
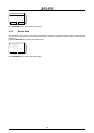
8.4.3 Fuels menu
You can read from the analyzer all data parameters for the stored fuels. Press the “read from instrument” button to
transfer, using the IR interface, the fuel data from the analyzer.
36