


7. CUSTOMIZING YOUR UNIT
7-19
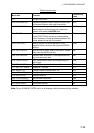
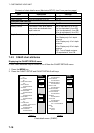
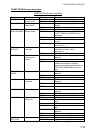
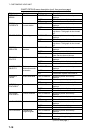
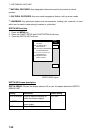
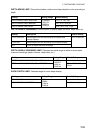
CHART DETAILS menu description (con’t from previous page)
Object Content Setting Description
ON Shown on plotter and overlay
displays.
AUTO Chart border lines are shown for the
last four charts in a chart card on the
plotter and overlay displays
PLOT/OVERLAY Chart border lines show on plotter and
overlay displays.
PLOT Chart border lines show on plotter
display.
CHART
BOUNDARIES
Chart boundary
lines
OFF Chart boundaries are turned off.
ON Mixing is active. MIXING Changes chart
scale to fit whole
chart on display
OFF Mixing is disabled.
LOCK Keeps current chart scale. CHART LEVEL Maintains current
chart scale
regardless of
zoom setting
UNLOCK Chart scale may chosen freely.
*
1
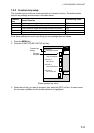
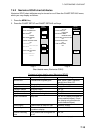
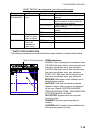
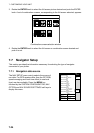
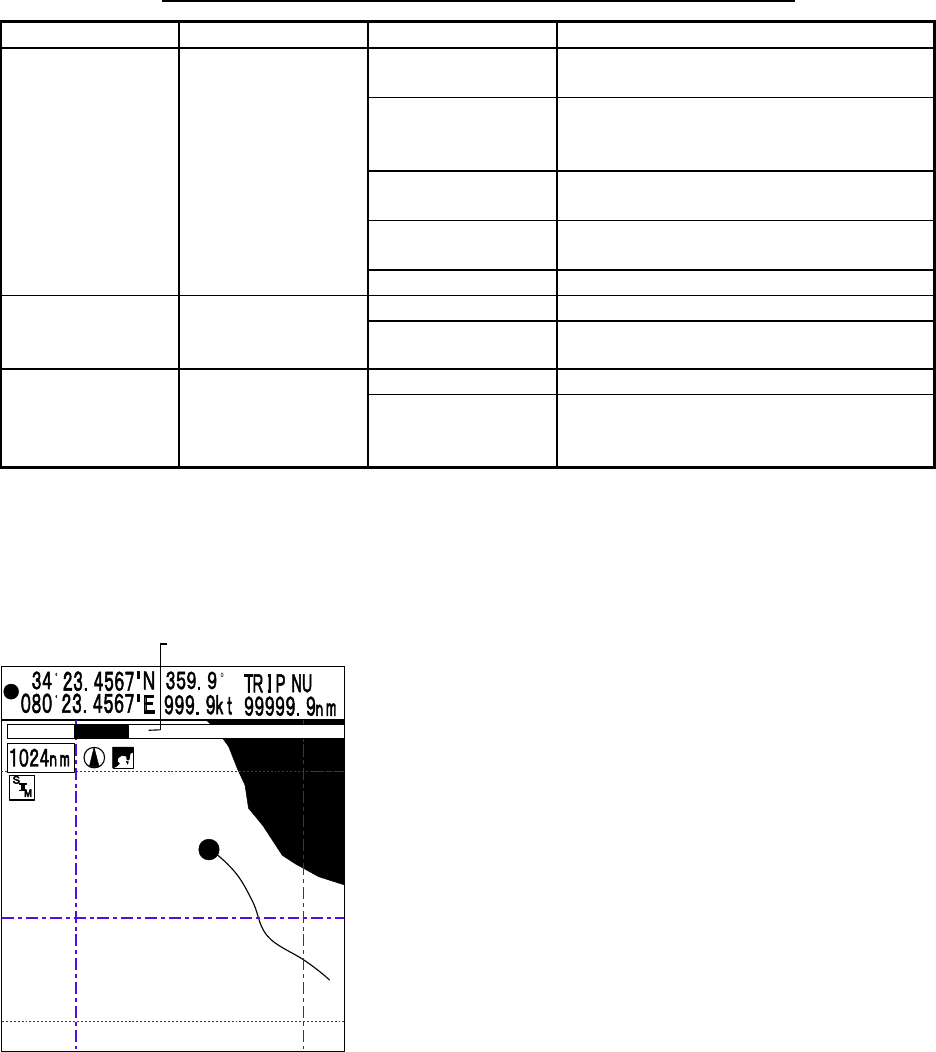
SAFETY STATUS INDICATION
The following indications are shown beneath the range indication to denote safety status:
ZOOM indications:
NORMAL: Chart is displayed at compilation scale.
U.ZOOM: Red when chart is under-zoomed more
than twice compilation scale, gray otherwise.
O.ZOOM: Red when chart is over-zoomed more
than twice compilation scale, gray otherwise.
CHART LOC: Red when chart is zoomed more
than twice compilation scale, gray otherwise.
BEST MAP: Red when a more detailed chart is
beneath cursor position.
DATA OFF: Red when the below-mentioned
objects or a layer within a layer is not displayed
by the user. Objects: DEPTH/SOUNDINGS,
WRECKS/OBSTRUCTIONS, TRACKS/ROUTES,
ATTENTION AREAS, NAVAIDS
DE-CLUTTER: Appears when the de-clutter
function is active.
DANGERS: Red when grounding alarm is
violated.
CAUTIONS: Red if vessel enters prohibited area
when grounding alarm is active.
SAFETY STATUS indication
NORMAL BEST MAP DATA OFF DE-CLUTTER DANGER