


Page 38 of 44
Catalog #91001, 91003, 91004, 91005, 91007, 91009
Rev. 2/06 - RS/mc
©2006 Edelbrock Corporation
Brochure #63-0282
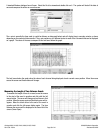
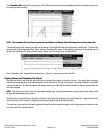
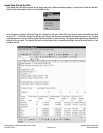
Obtaining a Histogram
QwikData allows you to obtain the frequency distribution for any channel over any time period. One useful example may be to obtain
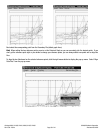
the RPM distribution over one lap, or one run, to help in camshaft selection. Select the desired period using the two cursors, then select
“Histogram” from the “Graph” menu of the Historical Data screen. A list of all available channels will be displayed. If the two cursor
are not set, the histogram is calculated based on the entire data file.
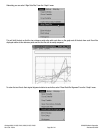
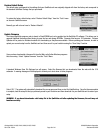
Click on your choice and a histogram will be produced. If you select the “Display” menu on the histogram screen, you have
the option of sending a copy of the histogram to your Windows system printer.
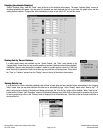
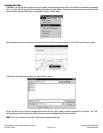
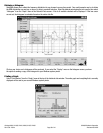
Printing a Graph
Select “Print Window” from the “Graph” menu at the top of the historical data window. The entire graph and everything that is currently
displayed will be sent to your current Windows system printer.