


Page 31 of 44
Catalog #91001, 91003, 91004, 91005, 91007, 91009
Rev. 2/06 - RS/mc
©2006 Edelbrock Corporation
Brochure #63-0282
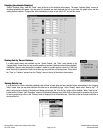
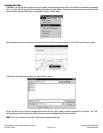
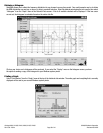
Changing the channels Displayed
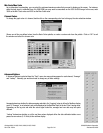
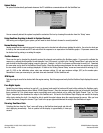
Choose “Graphing Setup” from the “Setup” menu at the top of the historical data window. The same “Graphing Setup” screen as
described previously will appear. You can select the channels you want displayed (up to 9 at one time), the graph colors, and the
scaling for each variable. Changes take effect immediately as soon as you select “OK” and exit the screen.
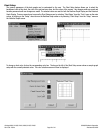
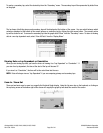
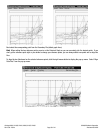
Viewing Data by Time or Distance
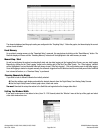
If a wheel speed sensor was installed and the “Speed Channel” and “Units” were entered in the
“Logging Setup” screen then you may view the graph as a function of distance instead of time (default).
Sometimes it may be more convenient to compare , events at a certain spot on a track (e.g. 1000 feet
down the track) as opposed to a fixed time as time may vary with fast or slow laps (runs). Select either
the “Time” or “Distance” options from the “Display” menu at the top of the historic data window.
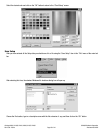
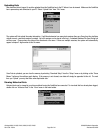
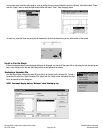
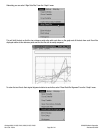
Viewing Data by Lap
If a lap beacon or a driver-controlled pushbutton was utilized to break data into laps, and this feature was enabled in the “Logging
Setup” screen, then you may view data from the entire run or individually by laps. In the “Display” menu, select “View by Lap”. (If
there is only one lap to display or the data is not broken up into laps, the “View By Lap” option will be disabled). When “View By Lap”
is selected the “Primary” and “Secondary” menus will be enabled allowing you to select both a primary and a secondary lap to view.
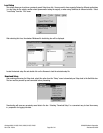
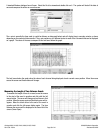
To view a particular lap, click on the “Primary” menu to display a list of all available laps. Then click on the lap that you would like to
view from the list.