


27
TRACKER 5100/5100i/5500/5500i Installation and Operation Manual
NAVMAN
13-2 Chart setup
Rotation
The options for chart rotation are:
North up: North is always at the top of the
chart display.
Track up: The chart is rotated so that the boat
direction is to the top of the display. This option
is useful for navigating narrow harbours or
rivers. The TRACKER asks for a course
deviation; this is how much the boat direction
needs to change to make the chart redraw.
Tip: If the chart redraws too frequently,
increase the course deviation setting.
Course up: This option is only available if the
boat is navigating to a destination. The chart is
rotated so that the plotted course to the
destination is vertical.
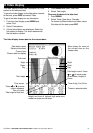
Projected course
The TRACKER can estimate the course after a given
time, based on the current speed and heading (see
section 3-4). The options are 2 minutes, 10 minutes,
30 minutes, 1 hour, 2 hours or Off.
CDI Scale
The CDI Scale is described in appendix C, CDI. The
options are 0.05, 0.1, 0.2, 0.5, 1.0, 2.0, 4.0 and 10.0
distance units.
Plotter mode
Occasionally it is desirable to use a chart scale which
is not available on a chart card. Examples are:
To zoom in to a small scale to track very small
boat movements.
If there is no detailed chart for an area, for
example when crossing an ocean.
If Plotter mode is On, then if the chart zooms to a
scale which is not available, the TRACKER will enter
plotter mode and will only display the boat position
and track (if enabled). Chart and map information
will no longer be displayed and the display is white
with black crosshatch lines.
For normal use, turn Plotter mode to Off.
Map datum and map shift
Satellite derived positions on the TRACKER are
based on a worldwide reference (datum) known as
WGS84. Most paper charts are based on WGS84.
However, some paper charts are not based on
WGS84, which results in an offset between a position
on the TRACKER and the same position plotted on
the paper chart.
To match the TRACKER’s positions with a local chart
that is not based on WGS84:
Either select Map datum and select the datum
for the local chart. See appendix A for a list of
the available datums. WGS84 is the default
datum, and the datum most commonly used on
paper charts.
Or, if the correct datum is not available, retain
the WGS84 datum and apply a map shift (see
below).
Map shift
Map shift is a correction applied to the TRACKER’s
positions so that they match a chart’s positions.
Warning: Map shift is for eliminating minor
offsets. It should not be used if the correct datum
is available. Use map shift with caution: incorrect
application will cause incorrect boat positions.
Set map shift
1 Move the boat to a known point on the chart,
for example a marina berth.
2 In the Chart setup menu, select Map shift.
3 Move the cursor to the position on the chart
where the boat actually is.
4 Press ENT to set the new map shift. The boat
will now be displayed at its actual location.
Clear map shift
Clearing the map shift removes any map shift from
the TRACKER’s positions.
1 In the Chart setup menu, select Map shift.
2 Press MENU and select Clear.
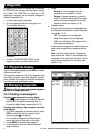
Waypoints
Controls how waypoints are displayed on the chart.
The options are:
Hide all: No waypoints are displayed.
Show all: All waypoints are displayed.
Selected: Waypoints with their display option
set to Icon or I+N (Icon and Name) are
displayed (see section 9).
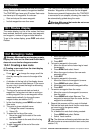
Chart display options
The other chart setup options allow an extensive
range of chart card features to be shown. Configure
the most useful display format.
Bathymetric Lines and soundings
Chart cards contain a large amount of spot sounding
and depth contour data. This can be selectively
displayed by turning Bathymetric Lines and Spot
Soundings on, then selecting the range to display
with Bath and Sndgs Min and Max.
Attention Areas
Areas of importance, such as restricted anchorages
and shallow areas, are highlighted as Attention Areas.